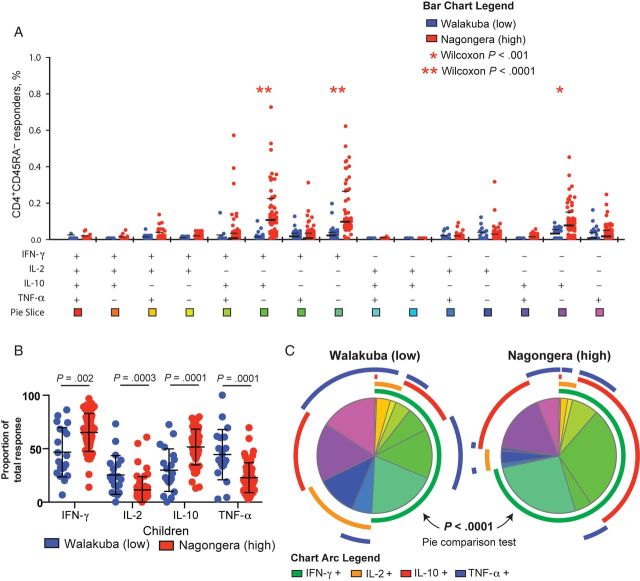
Figure 4.
Composition of Plasmodium falciparum–specific CD4+ T-cell response differs between children in a low-transmission setting and those in a high-transmission setting. A, Frequencies of P. falciparum–specific CD4−CD45RA− cells producing all possible cytokine combinations are shown separately for children from Walukuba and those from Nagongera. B, Proportional contribution of interferon γ (IFN-γ)–, interleukin 2 (IL-2)–, interleukin 10 (IL-10)–, and tumor necrosis factor α (TNF-α)–producing cells to the total P. falciparum–specific CD4+ T-cell response differed between Nagongera children and Walukuba children. C, The overall composition of responding cells differed significantly between Nagongera children and Walukuba children (P < .0001, by the partial permutations test).

