Fig. 1.

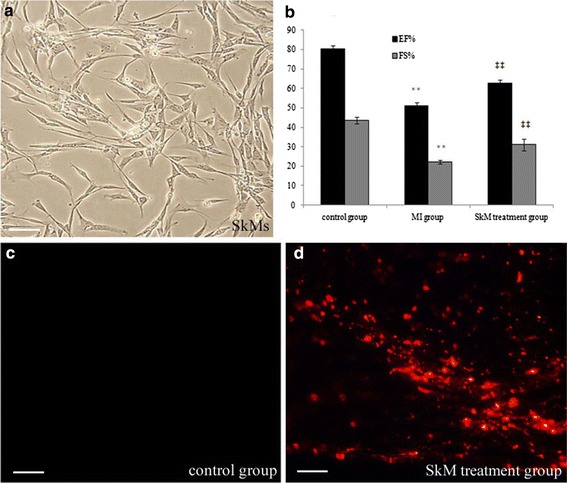
Effects of SkM cell therapy for rat MI on cardiac function. a Light-microscopy image of SkMs. Scale bar 50 μm. b Quantification of EF% and FS % were estimated at 4 weeks post-MI. The results are expressed as the mean ± SEM of six animals per group. **p < 0.01 vs. control group (Sham group); ‡‡ p < 0.01 vs. MI group. c There were no PKH26 + cells in the heart tissue of the control group. d Representative photomicrographs show donor PKH26 + transplanted cells in the border zone of a ischemic myocardium injected with SkMs as assessed under a confocal laser-scanning microscope. Scale bars 50 μm.
