Fig. 2.

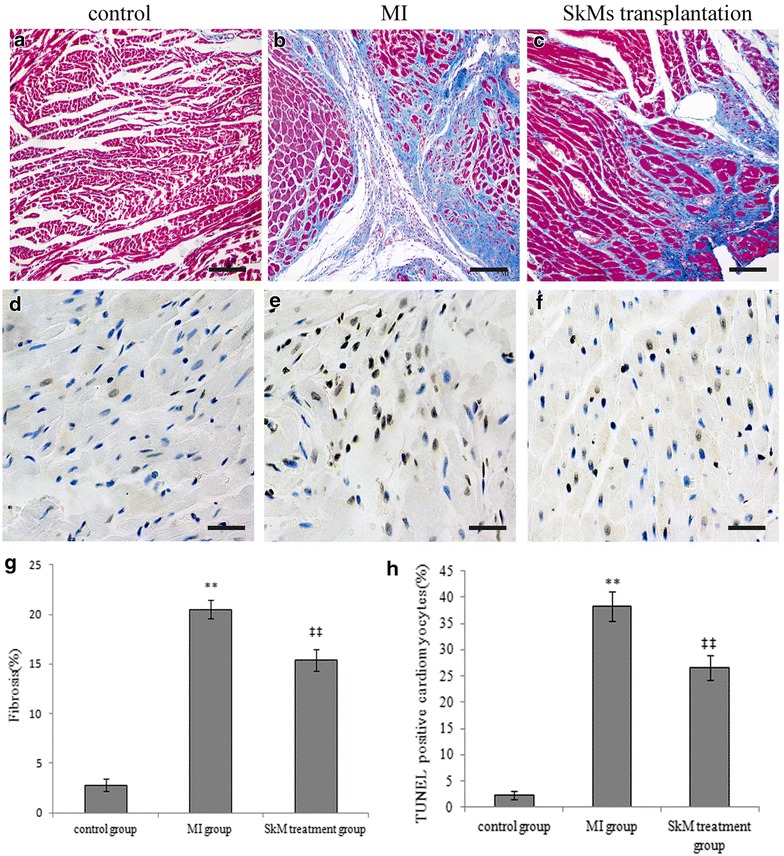
Infarct size and apoptosis were measured at 4 weeks post-MI. a–c Representative sections were stained with Masson trichome (collagen: blue, muscle: red) in different animal groups. Scale bar indicates 50 μm. d–f Representative sections were stained with TUNEL. Scale bar indicates 50 μm. g Quantitative data of fibrosis. Infarction size was attenuated in the SkM treatment group compared to the control group and MI group. **p < 0.01 vs. control group; ‡‡ p < 0.01 vs. MI group; n = 3 for each group. h The quantitative analysis of cardiomyocyte apoptosis was determined by the TUNEL staining assay. Data are presented as the mean ± SEM. Significance is indicated as **p < 0.01 vs. the control group; ‡‡ p < 0.01 vs. the MI group.
