Fig. 5.

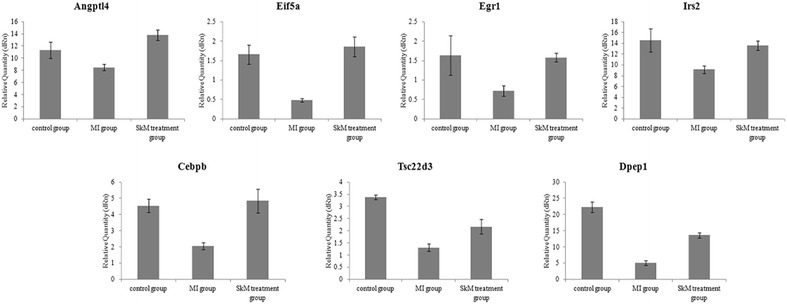
Expression of a subset of target genes differentially regulated in the array analysis was analyzed by RT-PCR. Gene expression in the three groups was compared. The diagrams show the relative mRNA levels.

Expression of a subset of target genes differentially regulated in the array analysis was analyzed by RT-PCR. Gene expression in the three groups was compared. The diagrams show the relative mRNA levels.