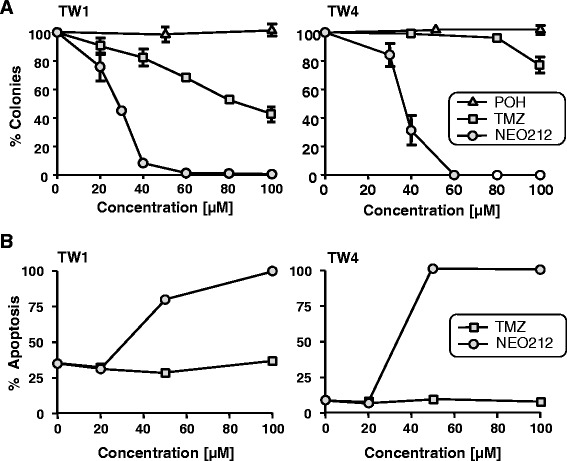
Fig. 2.

Survival of NPC cells after drug treatment with NEO212, TMZ or POH. a, TW1 and TW4 cells were exposed to increasing concentrations of NEO212 (circles), TMZ (squares) or POH (triangles) for 48 h, and survival was determined via colony formation assay (CFA). The number of colonies formed by untreated cells was set at 100 %; ±SD, n ≥ 3. b, Apoptosis of TW1 and TW4 cells after treatment with increasing concentrations of NEO212 (circles) or TMZ (squares), as measured by cell death ELISA assay (averages from 2 experiments)
