
Fig. 3.
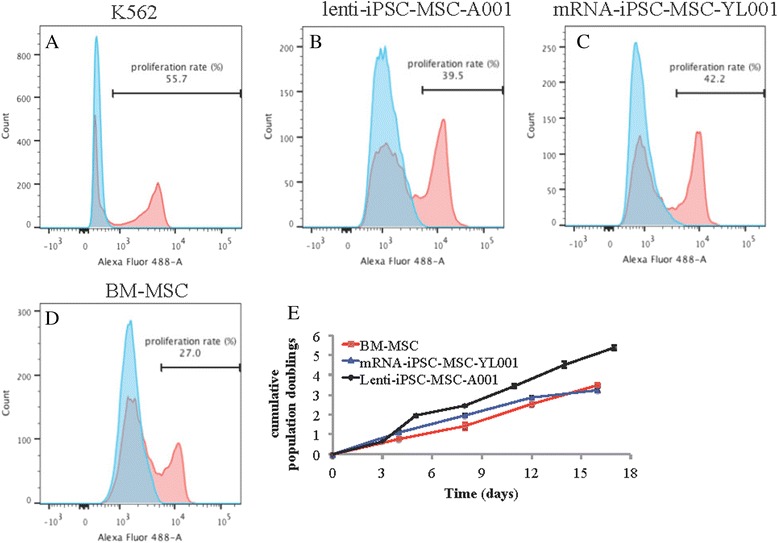
Characterization of cell proliferation and growth. Analysis of the cell proliferation rate with a Click IT cell proliferation assay in a control cell line (K562, chronic myeloid leukemia-derived cell line), b lenti-iPSC-MSC-YL001 (P7), c mRNA-iPSC-MSC-A001 (P7) and d BM-MSCs (P8). Blue plots represents negative control without EdU incubation. Pink plots represents cells treated with EdU. e Cumulative population doubling assay of the BM-MSCs (P11), miPSC-MSC-YL001 (P11) and lenti-iPSC-MSC-A001 (P8) for a period of 2 weeks. BM bone marrow, iPSC induced pluripotent stem cell, MSC mesenchymal stem cell