
Figure 2.
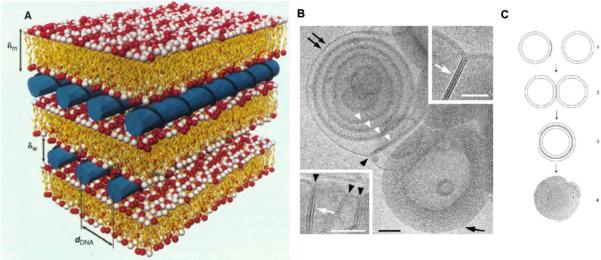
Schematic pictures of the local arrangement in the interior of the lipid/DNA complex (A); Cryo-TEM images of fusion of DOTAP/Cholesterol (1:1) liposomes induced by the addition of ONs. Black arrowheads indicates membrane junctions and white arrowheads in dicates a paired membrane. Scale bar: 50nm (B); Schematic model of lipoplex formation (C). Figure 2A was adapted from ref (45) and Figure 2B and 2C was adapted from ref (46) with permission.