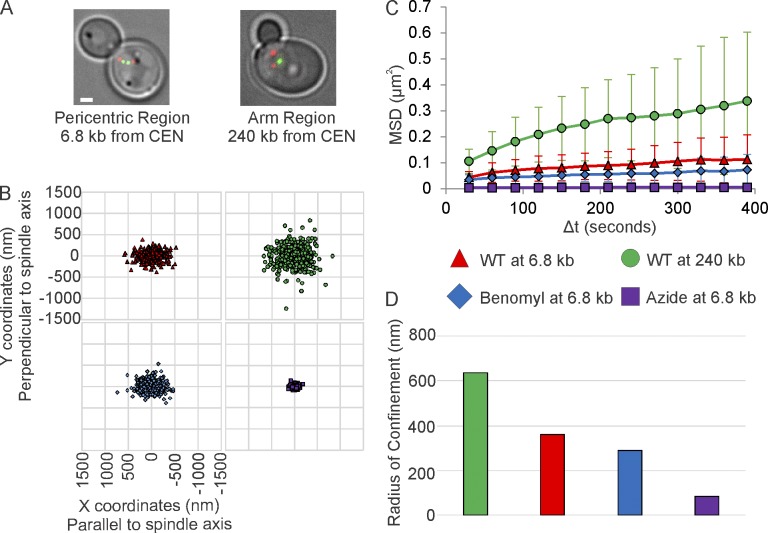
Figure 1.
Single-particle tracking of pericentric chromatin reveals fluctuations predicted from models of polymer chains tethered at both ends. (A) Representative images of metaphase yeast with a 10-kb lacO/LacI-GFP array at the pericentromere (6.8 kb) or chromosome arm (240 kb; green). Red, SPBs (pc29-RFP). Bar, 1 µm. (B) Scatter plots of 2D-position relative to the proximal SPB in untreated cells, cells treated with low-doses of benomyl, or with sodium azide + deoxy-glucose. The x-axis is set to the spindle axis. (C) MSD of arrays in untreated and drug-treated cells. Error bars are standard deviation. (D) Radii of confinement of untreated and drug-treated cells. Values were calculated from the entire population of data (B) from multiple experiments (WT at 6.8 kb, n = 41; WT at 240 kb, n = 40; Benomyl at 6.8 kb, n = 41; and Azide at 6.8 kb, n = 37). See Table 1 for alternative calculation methods for values with standard deviations. All values are significantly different (Levene’s Test, P < 0.05).

