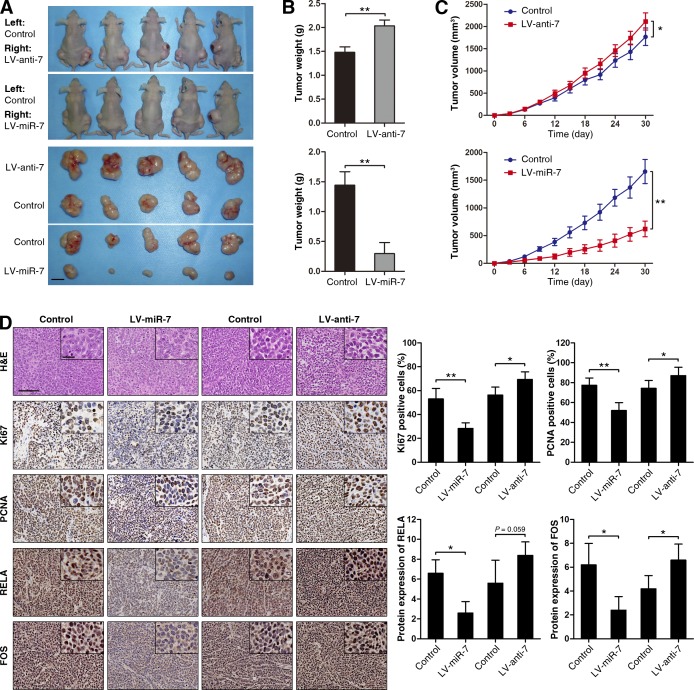
Figure 5.
miR-7 suppresses tumorigenesis in a xenograft model. (A) Representative image of tumors in nude mice after the injection of BGC823 cells stably expressing LV-miR-7, LV-anti-7, and their controls (n = 5). Bar, 1 cm. (B and C) Quantification of tumor weights (B) and growth curves (C) of xenograft tumors in mice. (D, left) Representative images of tumor samples that were stained with hematoxylin and eosin (H&E), Ki67, PCNA, RELA, and FOS by IHC. (right) The percentages of Ki67- and PCNA-positive cells and the levels of RELA and FOS protein expression were measured. Bars: (main) 100 µm; (insets) 25 µm. Error bars show SDs. *, P < 0.05; **, P < 0.01.

