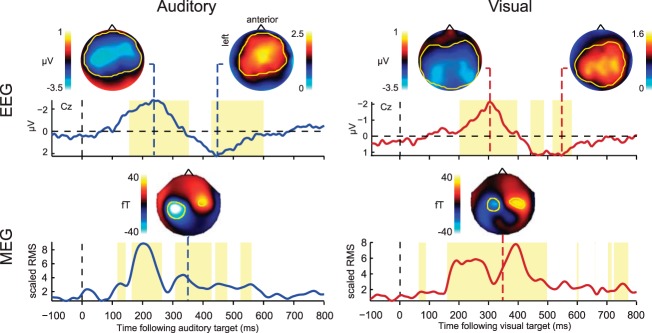
Fig. 5.

Experiment 2: grand average EEG and MEG responses to auditory and visual targets, averaging estimates from single-target trials (T1-alone and T2-alone, each with no-target trials subtracted) and dual-target trials (T1 + T2 at each SOA, each with T1-alone trials subtracted; see materials and methods). The EEG time course is illustrated for electrode Cz; topographies are plotted at negative and positive peaks (236 and 444 ms, respectively, following auditory target onset, and 300 and 544 ms following visual target onset). Overlaid yellow contours indicate significant difference from the baseline period, defining spatiotemporal components of interest (COI) for subsequent analyses; yellow time windows illustrate when these components were significant at any electrode, reflecting early (negative) and late (positive) EEG deflections for each sensory modality. The MEG time course shows RMS across all magnetometers within the COI, divided by the mean pretarget response. Topographies show the signal across the magnetometers at 348 ms following target onset.
