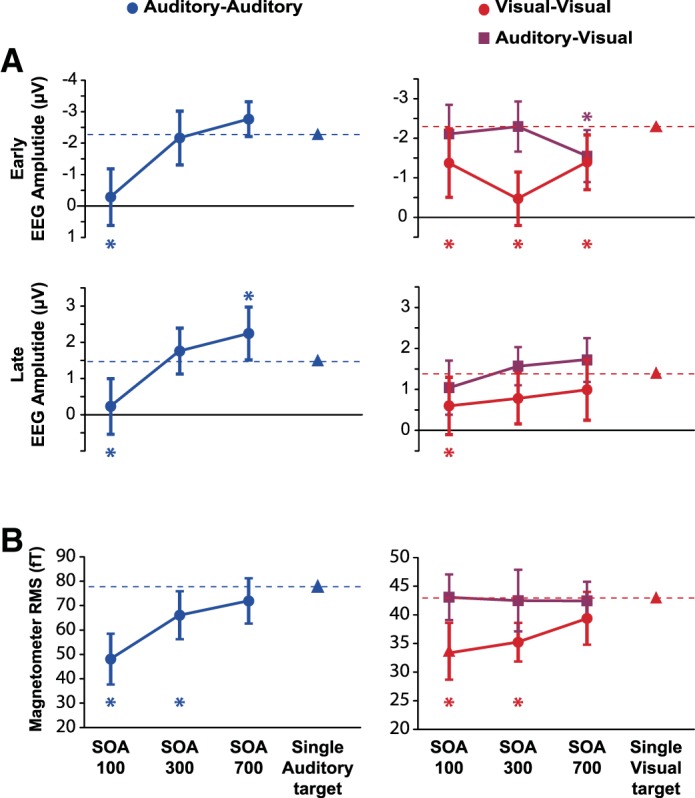
Fig. 6.

Experiment 2: EEG (A) and MEG (B) responses. Separate planned t-tests, within each session and each spatiotemporal COI, compared response amplitude to T2 at each SOA (T1 + T2 trials) with response amplitude to a single target of the corresponding modality. *P < 0.05 (2-tailed); error bars are 95% confidence intervals for the difference from the single-target response.
