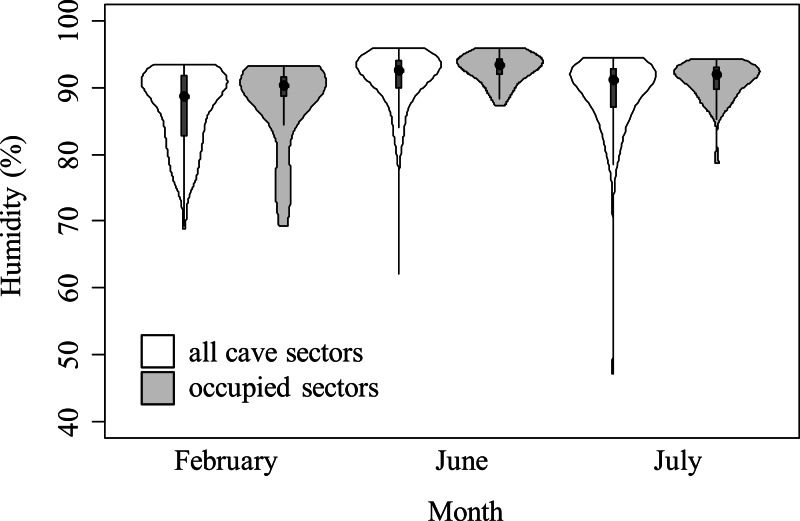
Figure 3. Violin plots representing humidity in cave sectors available (white) and occupied by cave salamanders (grey), during three months.
The area of violin plots represents the distribution of cave sectors according to microclimate feature. Width of plots is proportional to the number of sectors showing such microclimate condition. The black points represent the medians, the grey boxes represent the second and third quartiles. The violin plots for temperature are available in Fig. S2.

