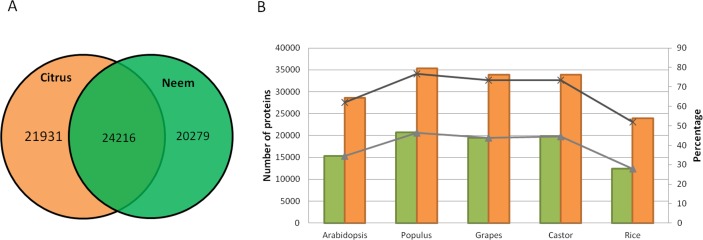
Figure 5. Comparison of neem genes with other sequenced plants.
(A) Schematic diagram showing common and unique genes between citrus and neem genomes. (B) Number and percentage of proteins having homolog hit in query (Arabidopsis, Populus, Grapes, Castor and Rice) with greater than 60% identity in genomes of neem and citrus.

