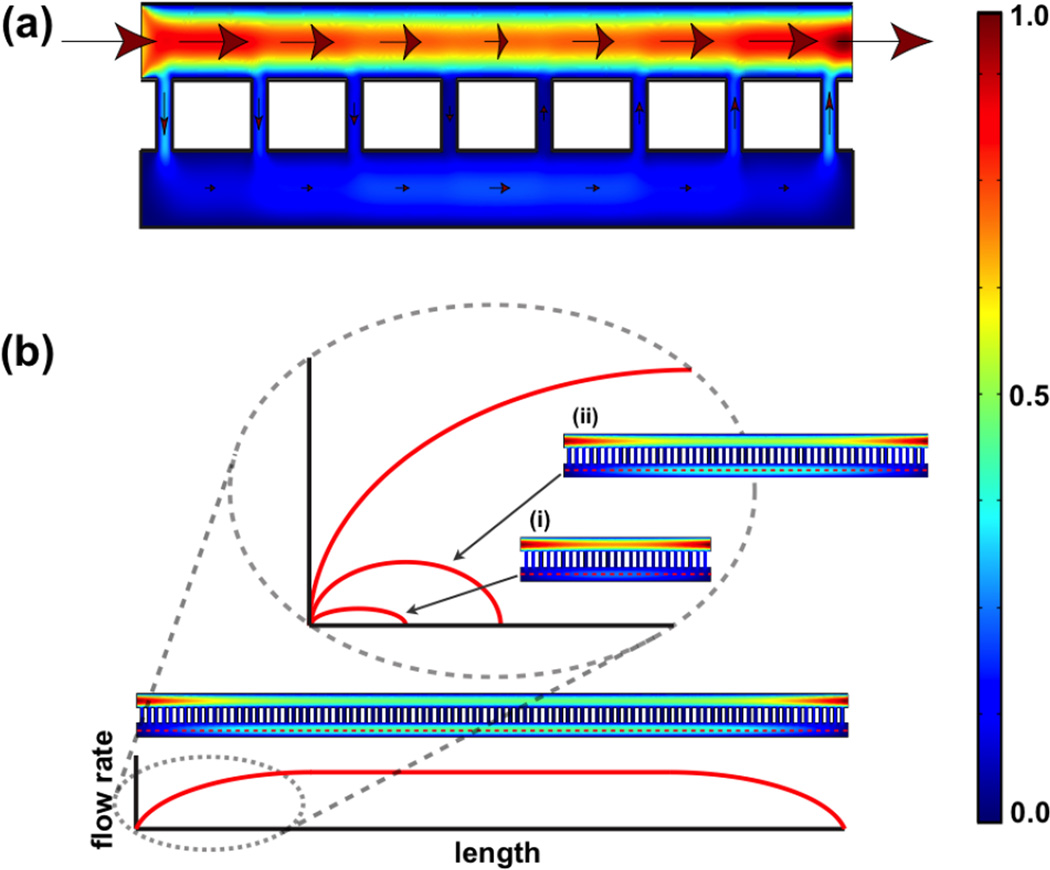
Fig. 4. Flow rate distribution predicted from COMSOL simulation.
(a) Simulation of a system with short membrane span. The arrows indicate the directions of flow and the size of the arrows represents the magnitude of flow rate (not drawn to scale). The heat map reference to the far right indicates the magnitude of flow rate, with the red and blue representing the normalized maximum and minimum. (b) Given a system with sufficiently long span of membrane, the flow rate in the cell chamber reaches a plateau value that is independent of the membrane. The key to achieving a shear-free condition is to use membranes that are much smaller than the length required to reach this plateau value.

