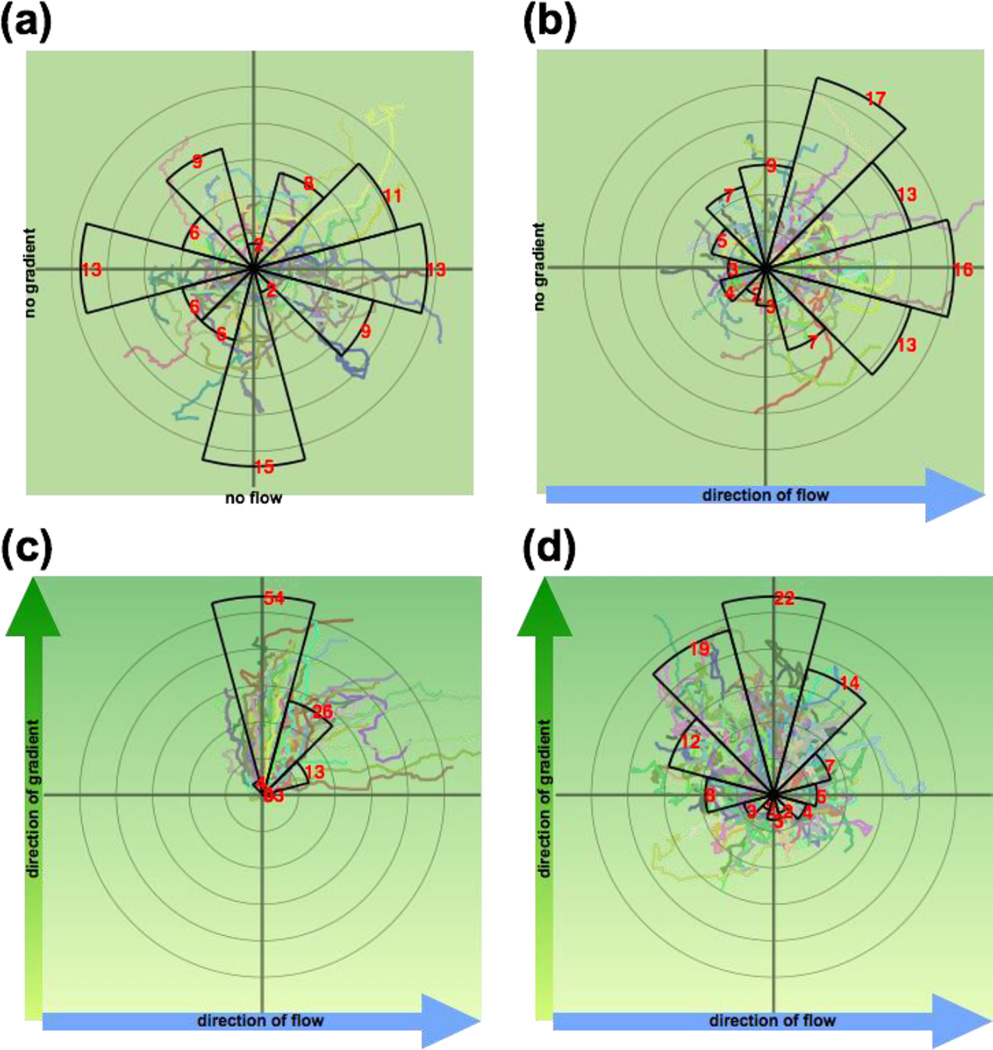
Fig. 7. Radial histograms of neutrophil migration.
Each sector spans 30°, and the distance between each pair of successive concentric rings is 50 µm. The red number and the radius of each sector represent the percentage of cells (n > 150) that migrated into each sector. Superimposed on the radial histogram are the actual trajectories of the migrating neutrophils, each with the starting position centered at the origin of the radial histogram. (a) Uniform fMLP (10 nM) stimulation and no flow; (b) Uniform fMLP (10 nM) stimulation with left-to-right flow; (c) System without membrane, bottom-to-top fMLP gradient (0 nM – 40 nM over 500 µm), and left-to-right flow. Downstream bias of cell migration is evident. (d) System with membrane, bottom-to-top fMLP gradient (0 nM – 40 nM over 500 µm), and left-to-right flow. In (b), (c), and (d), an input flow rate of 0.50 µL min−1 was used.

