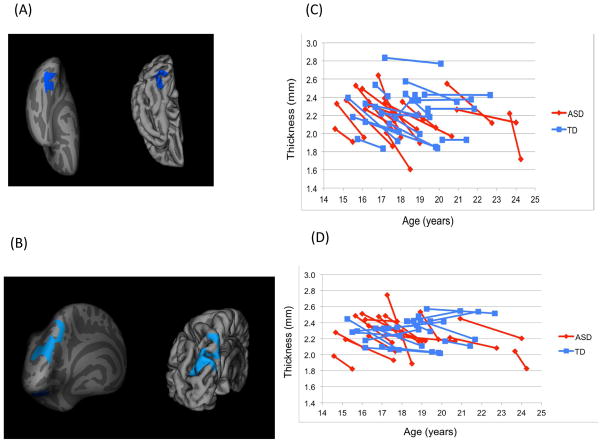
Figure 1.
Inflated and pial surface maps (dark gray=sulci; light gray=gyri) of (A) inferior and (B) posterior views of the left hemisphere showing greater rates of cortical thinning in the group with autism spectrum disorders (ASD) as compared to the group of typically developing (TD) controls (areas in blue are cluster corrected p<.01; clusters described in Table 2). Note: Line graphs of cortical thickness values are shown for each participant in the (C) left ventral occipitotemporal cluster (shown in Figure 1A) and (D) left superior parietal cluster (shown in Figure 1B) at time points 1 and 2.

