
Figure 2.
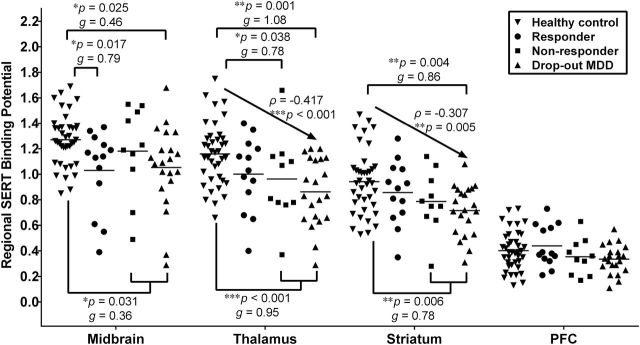
Scatter plots of pretreatment levels of serotonin transporter (SERT) binding between healthy controls (n = 39) and subjects with major depressive disorder (MDD; n = 39) that were categorized by their outcomes to 6-week antidepressant treatment: responders (n = 12), nonresponders (n = 9), and dropout subjects (n = 18). The horizontal bar indicates the mean value of SERT binding (*p < 0.05, **p < 0.01, ***p < 0.001 compared to healthy controls). Small, medium, and large effect sizes were defined respectively as 0.2 ≦ Hedges’ g < 0.5, 0.5 ≦ Hedges’ g < 0.8, and Hedges’ g ≧ 0.8. We coded healthy controls, responders, nonresponders, and dropout subjects as an ordinal variables 0, 1, 2, and 3, respectively. The Spearman’s rank correlations between the rank order and SERT binding were ρ = -0.417, p < 0.001 for thalamus; ρ = -0.307, p = 0.005 for striatum. PFC, prefrontal cortex.