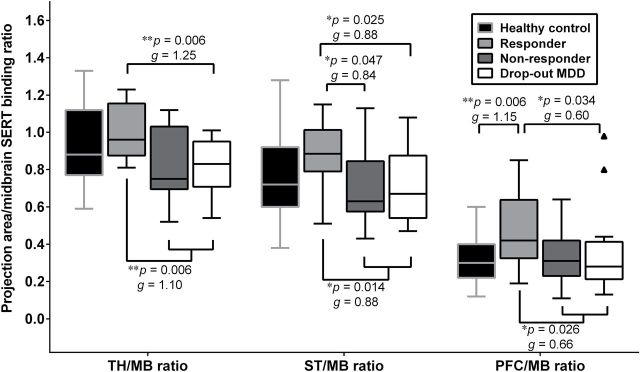
Figure 4.

The box-and-whisker plot of pretreatment serotonin transporter (SERT) binding ratios in the terminal projection regions relative to the midbrain raphe nuclei among healthy controls (n = 39), responders (n = 12), nonresponders (n = 9), and dropout subjects (n = 18) with major depressive disorder (MDD). The short horizontal bar within the box indicates the median value of SERT binding ratios (*p < 0.05, **p < 0.01 compared to responders). The interquartile range (IQR), which is the length of the box, can be used as a measure of how spread-out the values are. There were two outliers in the PFC/MB ratio in dropout subjects. Small, medium, and large effect sizes were defined respectively as 0.2 ≦ Hedges’ g < 0.5, 0.5 ≦ Hedges’ g < 0.8, and Hedges’ g ≧ 0.8. MB, midbrain; PFC, prefrontal cortex; ST, striatum; TH, thalamus.
