
Figure 2.
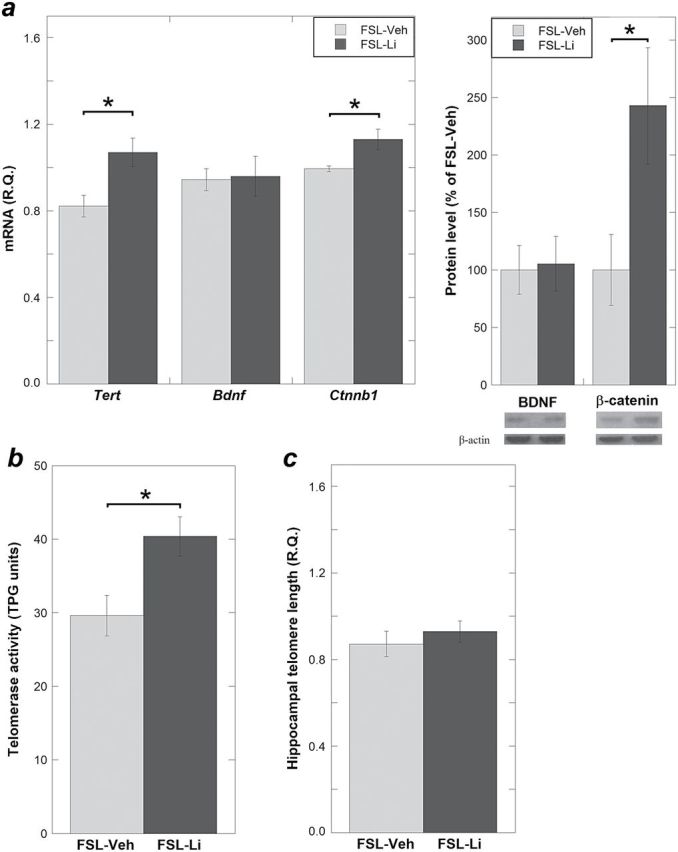
Expression levels of Tert, brain-derived neurotrophic factor (BDNF), β-catenin, telomerase activity, and telomere length (TL) measured in the hippocampus of vehicle-treated Flinders Sensitive Line (FSL) (FSL-Veh) and lithium-treated FSL (FSL-Li). (a) Tert mRNAs that showed different expression levels in hippocampi comparing naïve FSL with FRL were significantly upregulated in the FSL-Li group compared with FSL-Veh. This was associated with β-catenin upregulation both at mRNA (left) and protein (right) levels. (b) Consistent with the upregulation of Tert levels in the FSL-Li group, telomerase activity was also increased. (c) The point estimate of the telomere length mean was increased in the FSL-Li group; however, it was not significantly longer than in the FSL-Veh group. Gene expression data are presented as relative quantifications (R.Q.). Protein data are presented as percent of FSL-Veh. Lower right panels in (a) show representative Western-blot images of BDNF and β-catenin with β-actin as loading control. Telomerase activity is presented as TPG units. n = 6–8 animals per group; n=1 outlier was excluded in Figure 2a from each group; data are presented as means ± SEM, * P < .05.