Figure 5.
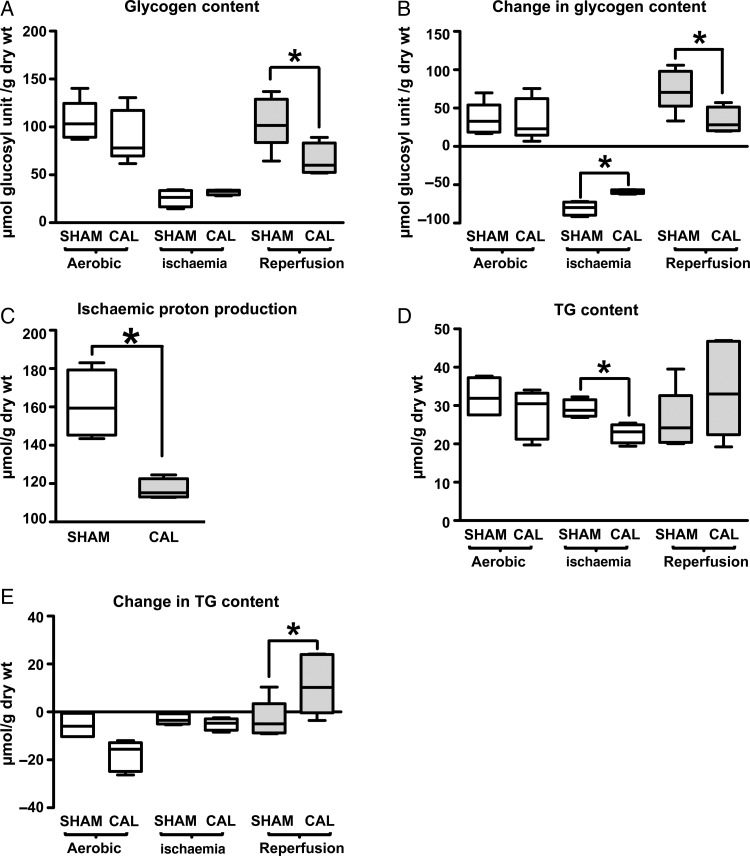
Contents and change of endogenous energy substrates in SHAM and CAL hearts. Glycogen content is shown in A at the end of aerobic perfusion (SHAM, n = 5 and CAL, n = 5), end of ischemia (SHAM, n = 4 and CAL, n = 4), and end of reperfusion (SHAM, n = 6 and CAL, n = 4). Changes in glycogen content during these intervals are presented in B. Ischaemic proton production from glycogen utilization is presented in C. Triglyceride (TG) content is shown in D at the end of aerobic perfusion (SHAM, n = 4 and CAL, n = 5), end of ischaemia (SHAM, n = 4 and CAL, n = 4), and end of reperfusion (SHAM, n = 6 and CAL, n = 5). Changes in TG content during these intervals are presented in E. Since data are not normally distributed, they are represented by box and whisker graphs. Medians are shown as a transverse line crossing the boxes. The upper and lower ends of the box represent the 75 and 25% quartiles, respectively. The upper and lower whiskers represent the 95th and 5th percentiles, respectively. *Differences are considered significant when P < 0.05.

