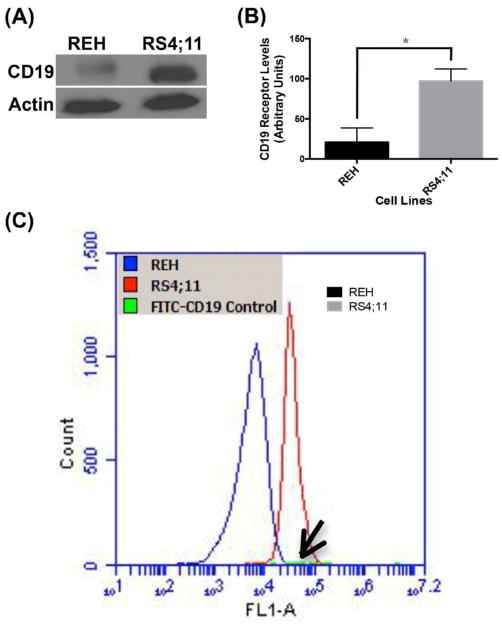
Figure 2. Quantification of CD19 total and surface expression levels in REH and RS4;11 BALL cells.

(A and B) Immunoblot and quantification of the CD19 levels. (C) Flow cytometry analysis of surface levels of CD19 (Note FITC-(anti-CD19Ab) control, arrow). Quantified data shown are averages of two independent experiments. Statistical significance was determined using a two-tailed Student's t-test where p value < 0.05 was considered significant
