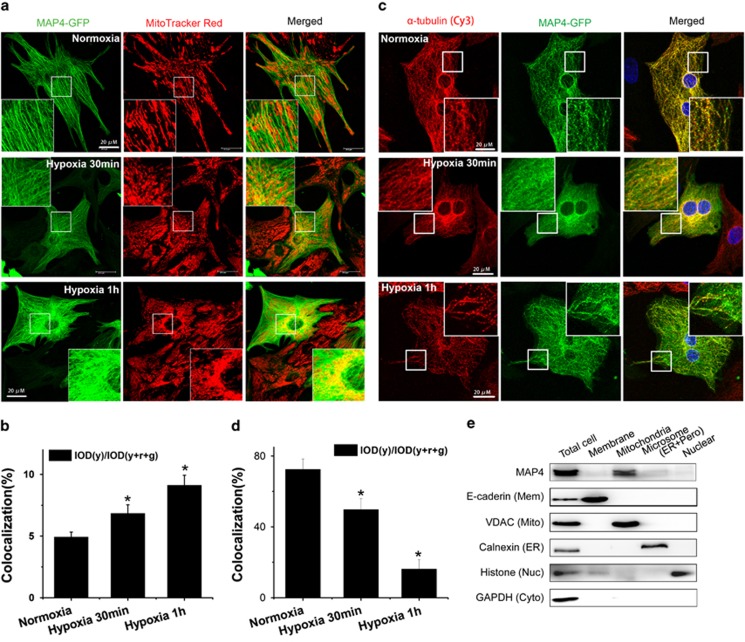
Figure 1.
Identification and localization of MAP4 in mitochondria. (a and b) Representative confocal immunofluorescence images (a) or quantitative analysis (b) showing increased colocalization of MAP4 with mitochondria under hypoxia stress. (c and d) Representative confocal immunofluorescence images (c) or quantitative analysis (d) showing decreased colocalization of MAP4 with microtubule under hypoxia stress. Yellow color reflects the overlap of MAP4-GFP (green) with mitochondrial tracker (red) or microtubule (red). Scale bar, 20 μm. For quantitative analysis, 10 cells were selected and calculated at random (n=3). Representative immunoblots showing subcellular location of MAP4 with corresponding markers (e). Mem, plasma membrane; Mito, mitochondria; ER, endoplasmic reticulum; Nuc, nucleus; Cyto, cytosol; Pero, peroxysome; TME, total mitochondrial extracts; OM, outer membrane; IMS, intermembrane space fractions; IM, inner membrane; MA, matrix fractions. All data are means±S.E.M.; *P<0.01 versus normoxia control by ANOVA with post hoc analysis

