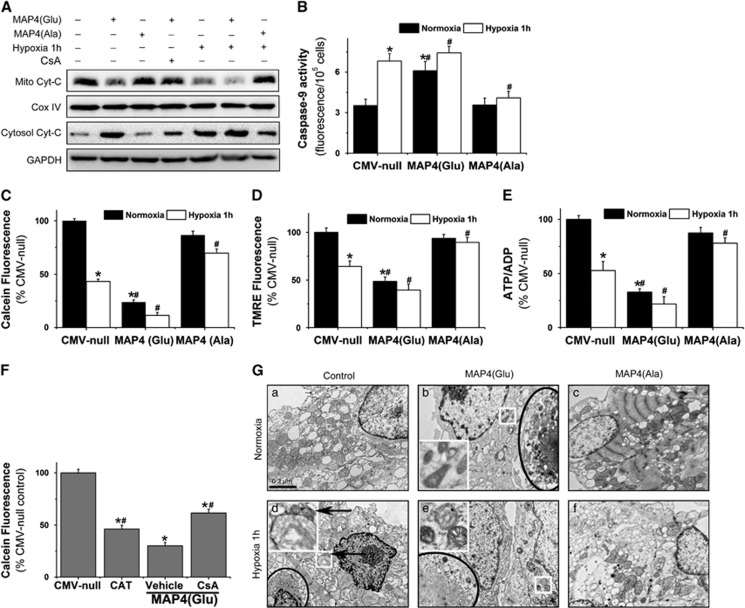
Figure 4.
Effect of p-MAP4 translocation on apoptotic mitochondrial changes in cardiomyocytes. (A) Detection of mitochondrial Cyt-C release by western blots. (B) Caspase-9 activity detected by Caspase-9 Fluorometric Assay Kit. (C and D) Assay of mPTP opening by calcein fluorescence (C) or mitochondrial membrane potential by tetramethylrhodamine ethyl ester (TMRE) (D). *P<0.01 versus normoxia CMV-null; #P<0.01 versus hypoxia CMV-null. (E) ATP/ADP detected by ADP/ATP ratio assay kit. (F) mPTP opening, as reflected by the decrease of calcein fluorescence, was induced by MAP4(Glu) that could be inhibited by CsA (5 μM). (G) Representative electron microscope images showing typical apoptosis (black circled area in b, d and e) and swelling (enlarged white square area in d) or shrinked (black arrow in d and enlarged white square area in b and e) mitochondria induced by hypoxia or MAP4(Glu). a is the normal control, and the MAP4(Ala) protects the cells from the apoptosis (c, f). *P<0.01 versus CMV-null control; #P< 0.01 versus MAP4(Glu) overexpression vehicle group. MAP4(Glu): MAP4(S696G, S678G, S787G), MAP4(Ala): MAP4(S696A, S678A, S787A). A total of 20 images are selected at random and analyzed for each group. All data are mean±S.E.M. of six independent experiments performed in triplicate

