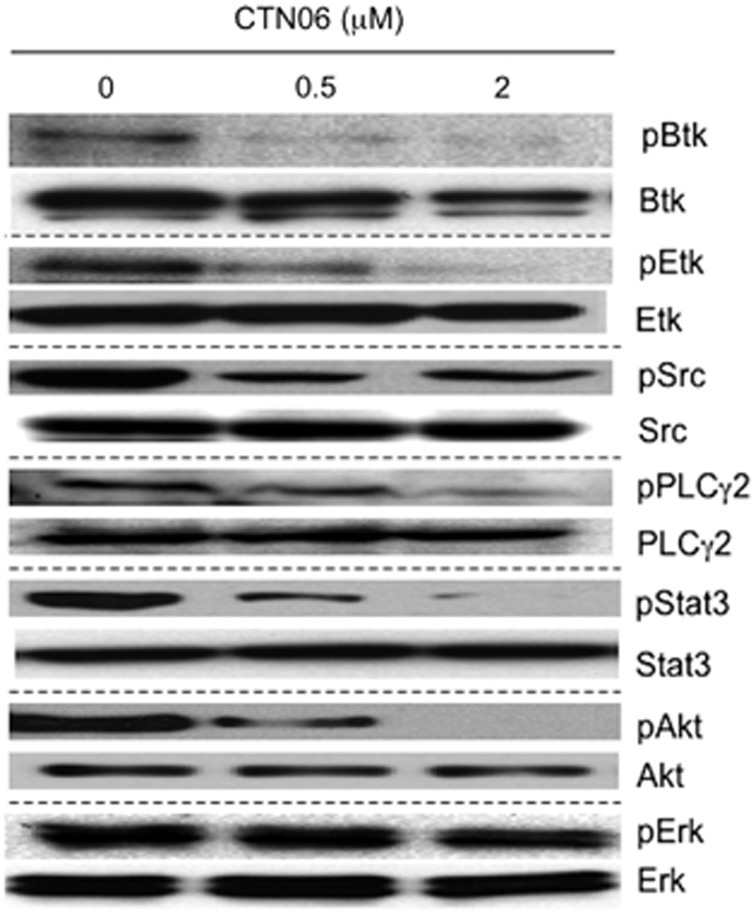
Figure 5.
Inhibition of cell signaling in PC3 cells following treatment with CTN06. Cells were grown in 100-mm plate to 50% confluence and treated with CTN06 at the indicated concentrations. Cells were harvested after 12 h. pEtk, Etk, pBtk, Btk, pSrc, Src, pPLCγ2, PLCγ2, pStat3, Stat3, pAkt, Akt, pERK and ERK levels were measured using the corresponding antibodies by western blot. One of three similar experiments depicted

