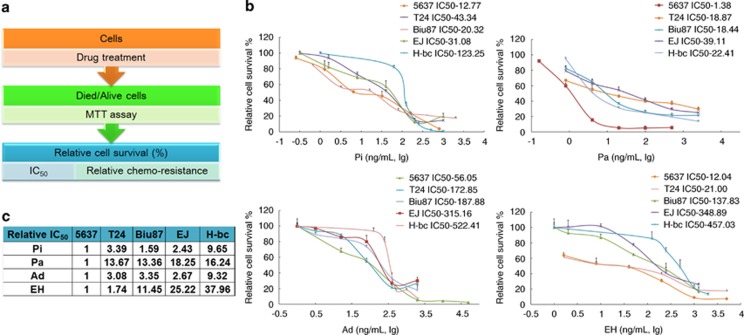
Figure 1.
Chemoresistance profiling of five BCa cell lines. (a) The experimental scheme. (b) The IC50 of four indicated chemotherapeutics of BCa cells. The percentage of the relative cell survival rates over the mock treatment was calculated and plotted against l g ng/ml of drug. (c) The relative IC50 (-fold) with the lowest IC50 (5637 cell line) are presented in Table

