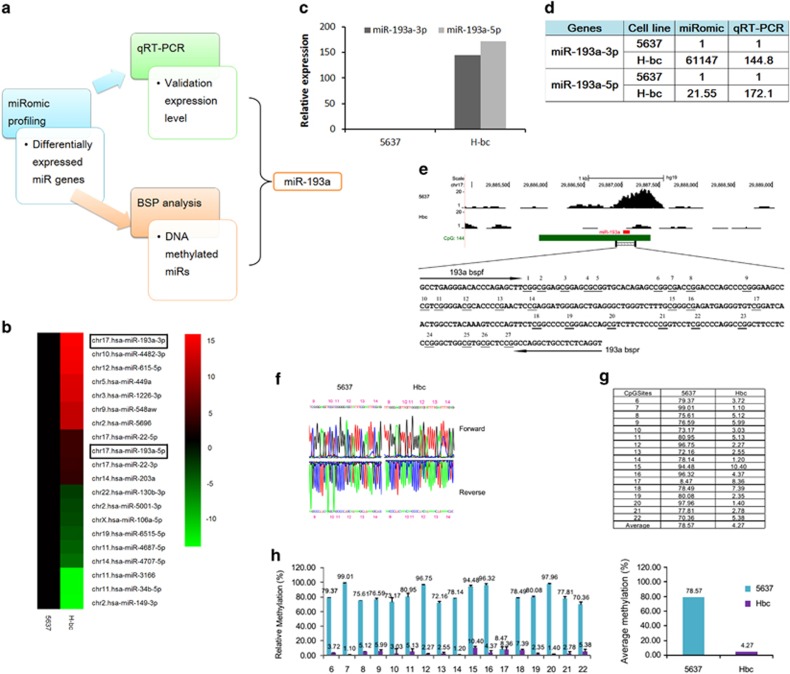
Figure 2.
Differential methylation/expression of the miR-193a gene in 5637 versus H-bc cells. (a) The experimental scheme. (b) The top differentially expressed CGI containing miRs from the seq-based miRomic analysis in Heatmap. The relative expression (fold) of both miR-193a-3p and -5p between 5637 and H-bc, validated by qRT-PCR analysis (c) and summarized in the Table (d). (e) DNA methylation state of the miR-193a gene from the Methyl-cap-seq analysis, which are indicated as dark peaks. CpG dinucleotides and the BSP primers are also shown. (f) The original sequencing result of both strands of the PCR product of the bisulfite-converted DNA are shown. The percentage of the CpG methylation is summarized in the table (g) and in the plot (h)

