Figure 3.
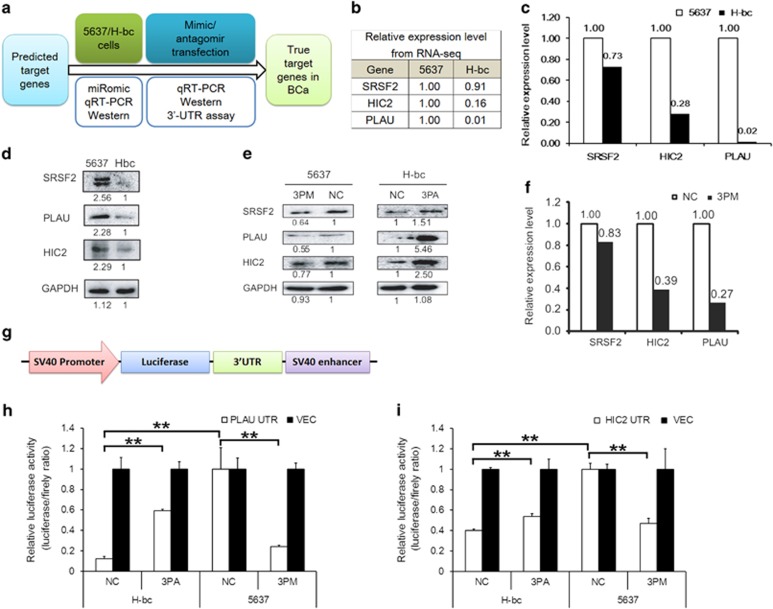
Expression of the miR-193a-3p's target genes in a reverse pattern of miR-193a-3p. (a) The experimental scheme. Expression of SRSF2, HIC2 and PLAU genes in 5637 versus H-bc cells at the mRNA level from the RNA-seq analysis (b) and by qRT-PCR (c) as well as at the protein level (d). Expression of SRSF2, HIC2 and PLAU genes in the miR-193a-3p mimic (3PM)-transfected 5637 and miR-193a-3p antagomiR (3PA)-transfected H-bc cells at the protein level by western blotting analysis (e) and mRNA level by qRT-PCR (f). (g) The schematic map of the pGL3-based luciferase reporter constructs where the UTR region (3′-UTR) of HIC2 or PLAU gene was put at the downstream flank of luciferase gene. The luciferase activity (fold) of the pGL3 with PLAU-UTR sequence (h) or HIC2 (i) relative to VEC (with no UTR seq) was determined in the cells transfected with the miR-193a-3p mimic (3PM), antagomiR(3PA) or Scramble (NC). The representative results from three independent experiments are shown. Error bars represent S.E.M. **P<0.01; by Student's t-test

