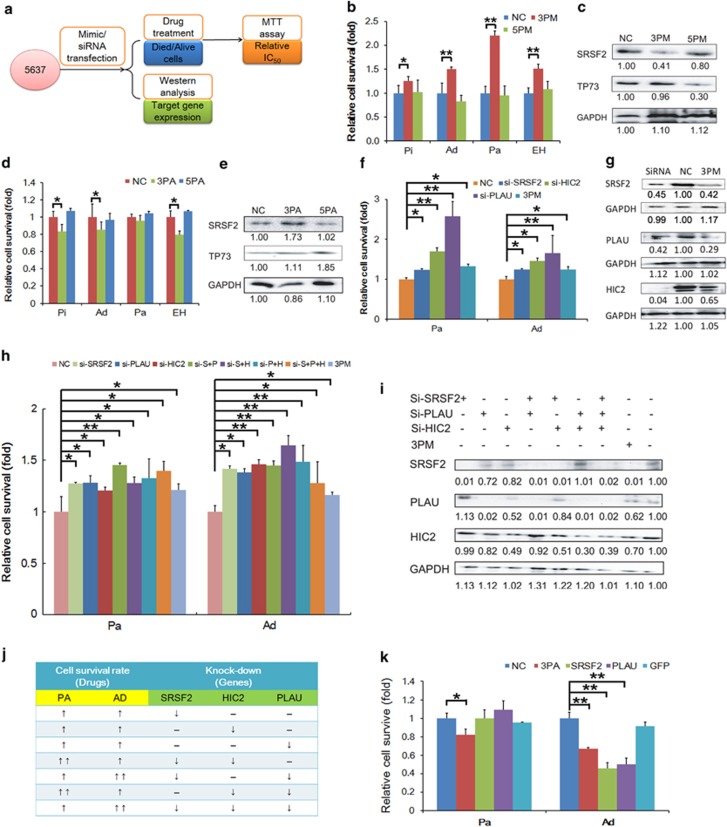
Figure 4.
The effect of both miR-193a and its target genes on the BCa chemoresistance. (a) The experimental scheme. (b) The relative cell survival by the IC50-dosed indicated drugs in the miR-193a-3p (3PM) or miR-193a-5p (5PM) mimic versus the mock (NC) of 5637 cells in plot. (c) The relative level of both SRSF2 (-3p target) and TP73 (-5p target) normalized with the GAPDH level, in the same set of 5637 cells in panel (b). (d) The relative cell survival by the IC50-dosed indicated drugs in miR-193a-3p (3PA) or miR-193a-5p (5PA) antagomiR versus the mock (NC) in H-bc cells in plot. (e), The relative level of SRSF2 (-3p target) and TP73 (-5p target) proteins normalized with the GAPDH level, in the same set of H-bc cells in panel (d). (f) The relative cell survival of the siRNA or 3PM-transfected or NC-transfected 5637 cells under the IC50-dosed Pa and Ad, respectively. (g) The protein level of the downstream genes in the same set of cells in panel (f), by western blotting analysis. (h) The relative cell survival of 5637 cells transfected with the indicated transfection under the IC50-dosed Pa and Ad, respectively. (i) The protein level of the experiment in panel (h) (Pa-treated group), by western blotting analysis. (j) The summary of the effects on the cell survival of the IC50-dosed drug-trigger cell death by miR-193a-3p's target genes. (k) The relative cell survival under the treatment of the IC50-dosed Pa and Ad in H-bc cells transfected with the SRSF2-GFP, PLAU-GFP expression constructs, 3PA or NC, respectively. (*P<0.05; **P<0.01)

