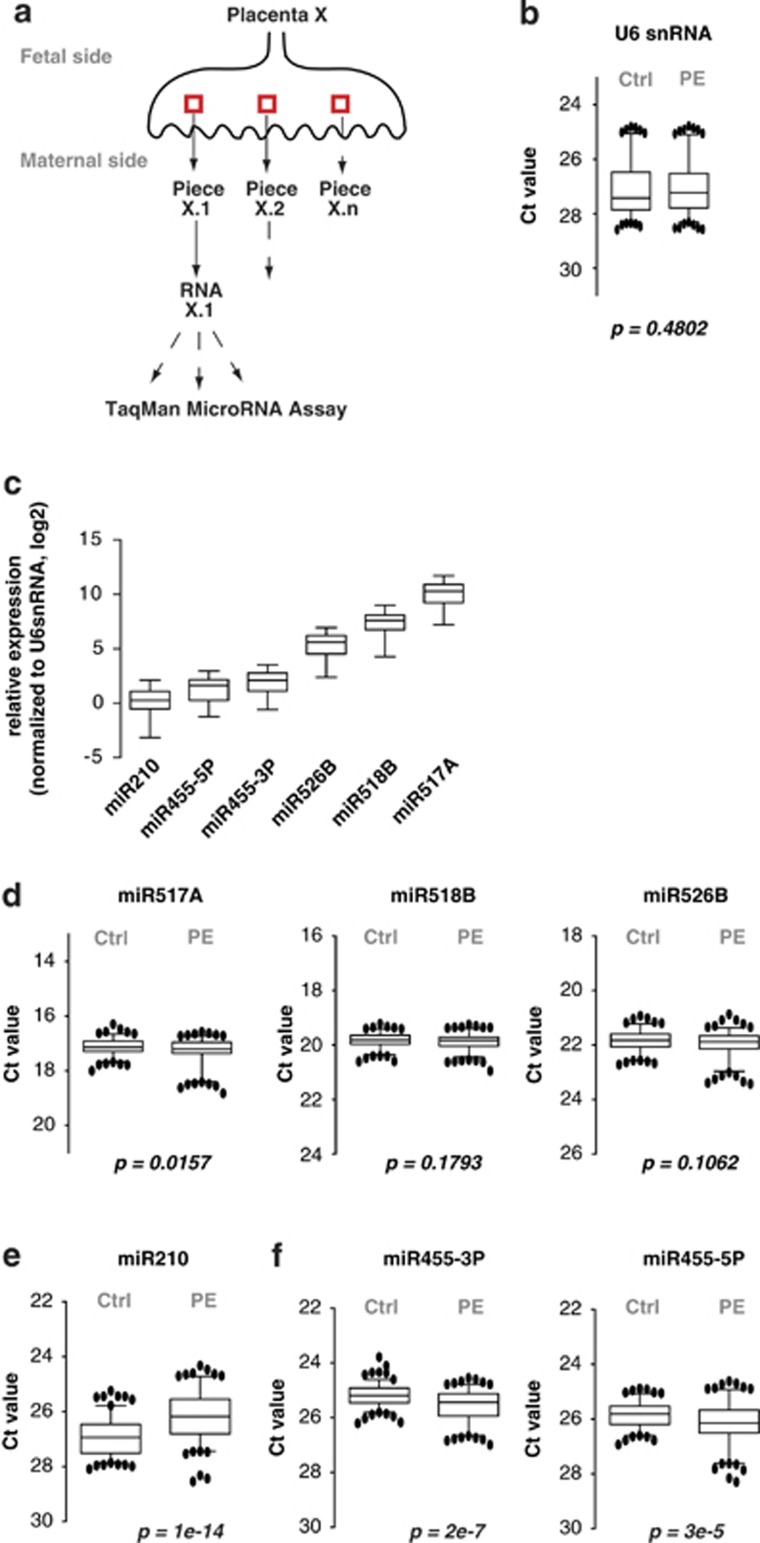
Figure 2.
miR455 and miR210 are deregulated in preeclampsia (PE) placentas. (a) Schematic diagram of placenta processing. Circa 3–4 pieces (red box) were dissected from the inner part of each placenta (X) to limit maternal contamination. Total RNA was extracted from each placenta piece (X.1 to X.n) and miRNA expression levels measured in three technical replicates by qRT-PCR using TaqMan assays. (b) U6 snRNA expression in PE and control (Ctrl) placentas. U6 snRNA levels were measured by TaqMan qRT-PCR. The cycle threshold (Ct) value obtained for U6 snRNA is plotted as a whiskers box plot 5th–95th percentile representation. The P-value was calculated by Mann–Whitney test. (c) miRNAs expressed in placentas. The expression of six selected miRNAs was determined by TaqMan qRT-PCR in control placentas. For each miRNA, expression was normalized to U6 snRNA and plotted on a log2 scale using a whiskers box plot 5th–95th percentile representation. (d) MicroRNAs that are not expressed differentially in control versus PE placentas. (e) miR-210 levels are higher in PE than control placentas. (f) miR-455 levels are lower in PE than control placentas. (d–f): P-values were calculated by Mann–Whitney test

