Figure 1.
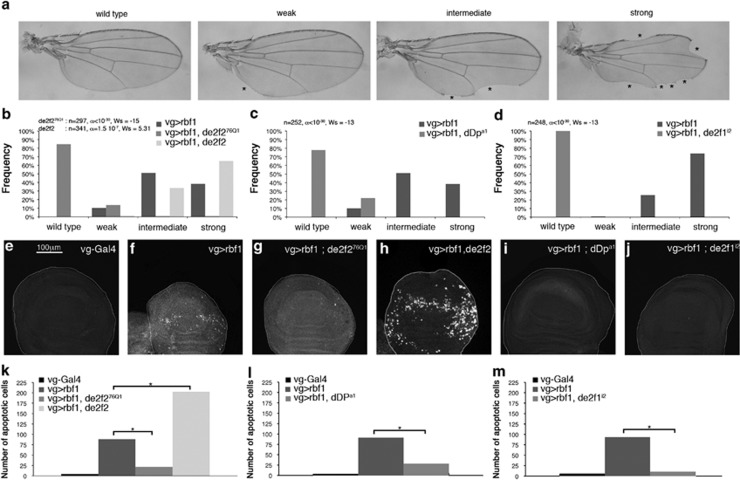
Rbf1-induced apoptosis involves dE2F2 and dDP. (a) Wing phenotypes were grouped in four categories (wild type, weak, intermediate and strong) according to the number of notches observed on the wing margin (asterisks). (b–d) Distribution of notch wing phenotypes in vg-Gal4>UAS-rbf1, vg-Gal4>UAS-rbf1; de2f276Q1 and vg-Gal4>UAS-rbf1, UAS-de2f2 (b), in vg-Gal4>UAS-rbf1 and vg-Gal4>UAS-rbf1; dDpa1 (c), and in vg-Gal4>UAS-rbf1 and vg-Gal4>UAS-rbf1; de2f1i2 (d). Statistical analysis was performed using Wilcoxon tests. Each experiment was independently performed three times; as the results were similar, only one experiment is presented here. (e–j) Apoptotic cells were visualized by TUNEL staining (white dots) of wing imaginal discs of the genotype indicated at the top of the image. All the pictures are at the same scale, scale bar: 100 μm. (k–m) Quantification of TUNEL-positive cells in the wing pouch. Asterisks indicate a statistically significant difference between two genotypes (Student's t-test, P<0.05)

