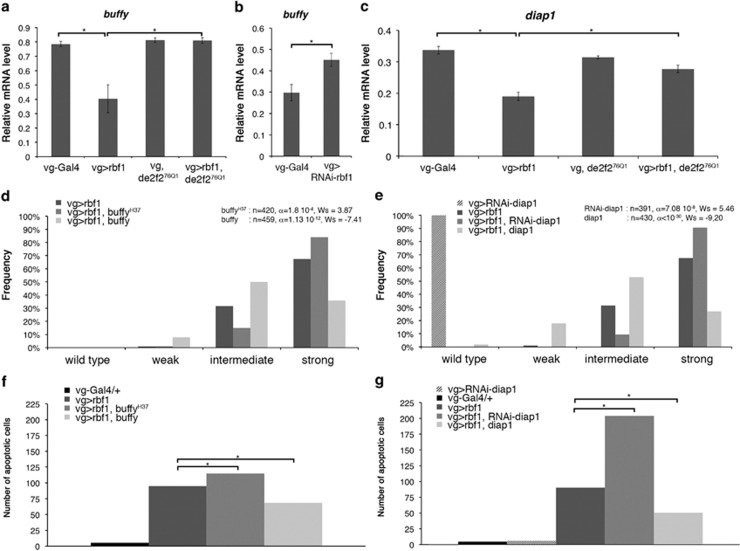
Figure 2.
rbf1 overexpression induces downregulation of buffy and diap1 mRNA. (a–c) Quantification of buffy (a, b) and diap1 (c) mRNA by RT-qPCR in wing imaginal discs. Data are normalized against rp49 and correspond to the mean of three independent experiments. Error bars are the S.E.M. Asterisks indicate statistical significant difference between two genotypes (Student's t-test, P<0,05). (d, e) Distribution of notches in wings of vg-Gal4>UAS-rbf1, vg-Gal4>UAS-rbf1; buffyH37 and vg-Gal4>UAS-rbf1; UAS-buffy flies (d), vg-Gal4>UAS-rbf1, vg-Gal4>UAS-rbf1; UAS-RNAi-diap1 and vg-Gal4>UAS-rbf1; UAS-diap1 flies (e). Wing phenotypes were grouped in four categories according to the number of notches (wild type, weak, intermediate, strong). Statistical analysis was performed using Wilcoxon tests. Each experiment was independently performed three times; as the results were similar, only one experiment is presented here. (f, g) Quantification of TUNEL-positive cells in the wing pouch. Asterisks indicate a statistically significant difference between two genotypes (Student's t-test, P<0.05)

