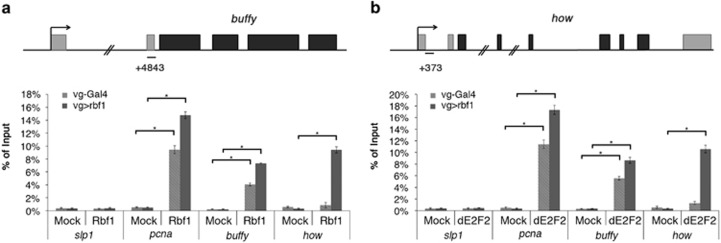
Figure 4.
Binding of Rbf1 and dE2F2 on buffy and how genes. Structure of buffy (a) and how (b) genes. qPCR amplicons are indicated. Coordinated of qPCR amplicons relative to TSS are indicated. ChIP-qPCR analysis of buffy (a) and how (b) from vg-gal4>UAS-Rbf1 or control (vg-Gal4/+) wing imaginal discs using mock, anti-Rbf1 or anti-dE2F2 antibodies. The results were expressed as percentages of input. slp1, a nontarget gene of Rbf1, was used as a negative control whereas pcna, a known dE2Fs target, was used as a positive control. Error bars represent S.E.M obtained from three independent experiments. Asterisks indicate statistically significant difference between two genotypes (Student's t-test, P<0.05)

