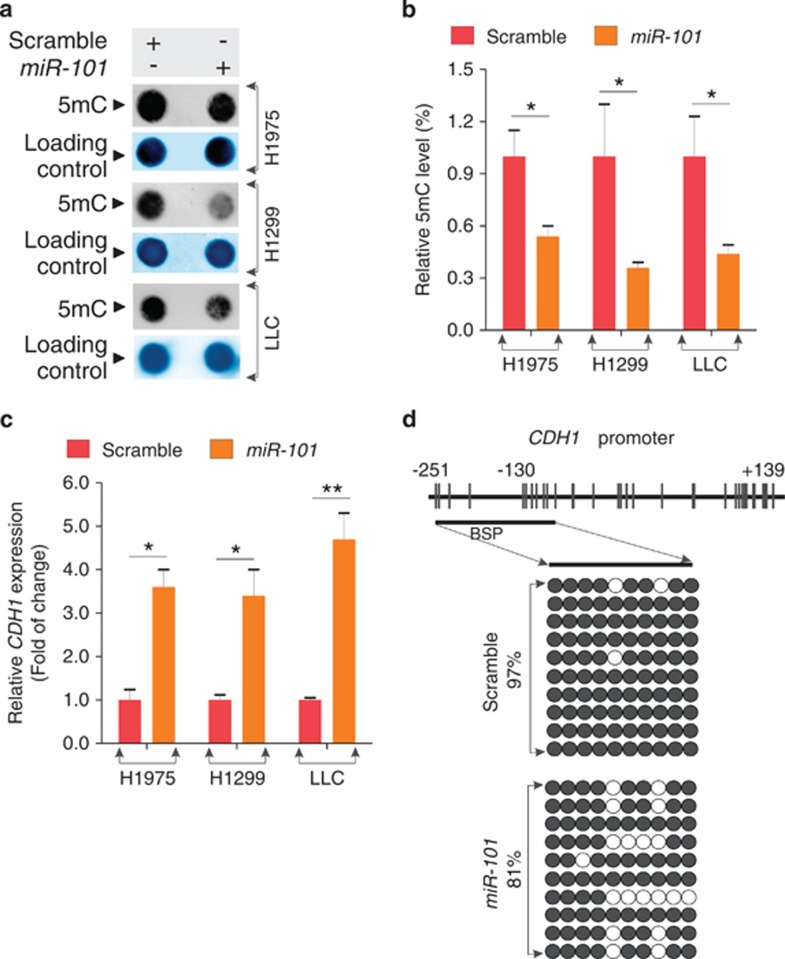
Figure 3.
MiR-101 expression induces DNA hypomethylation. (a) The genomic DNA was prepared from H1975 or H1299, or LLC cells transfected with miR-101 or scramble for 48 h and subjected to Dotblot using 5mC antibody. Representative images are shown. Bottom: equal DNA loading was verified by staining the membranes with 0.2% methylene blue. (b) Graphs are the quantification of Dotblot intensity reported in a. The data are represented as mean±S.D. from three independent experiments, *P<0.05. (c) qPCR analysis for the expression of tumor suppressor CDH1 in H1975 or H1299, or LLC cells transfected with miR-101 or scramble for 48 h. The data are represented as mean±S.D. from three independent experiments, *P<0.05, **P<0.01. (d) Bisulfite analysis for the change of DNA methylation in CDH1 gene promoter in H1299 cells transfected with miR-101 or scramble for 48 h. Upper: distribution of CpG dinucleotides is indicated as small vertical lines. Numbers refer to position relative to the transcriptional starting site (TSS) of CDH1; lower: open circles indicate unmethylated CpG sites, filled circles indicate methylated CpG sites. Results of 10 clones are presented

