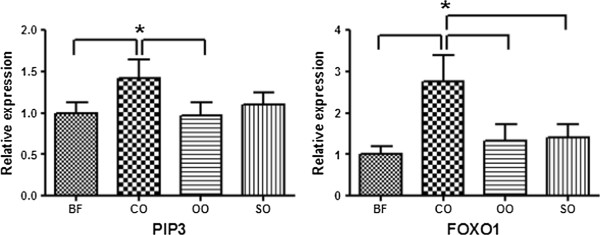
Figure 2.

Expression patterns of differentially expressed genes in four dietary oil groups in gilts, as determined by qRT-PCR. Dietary fat sources were BT (beef tallow), CO (coconut oil), OO (olive oil), and SO (soybean oil), which were added to concentrations of 3.0% in feed. Experiments were performed using the LM from three gilts, and data are expressed as mean ± SD. Asterisks show statistically significant values (*P < 0.05).
