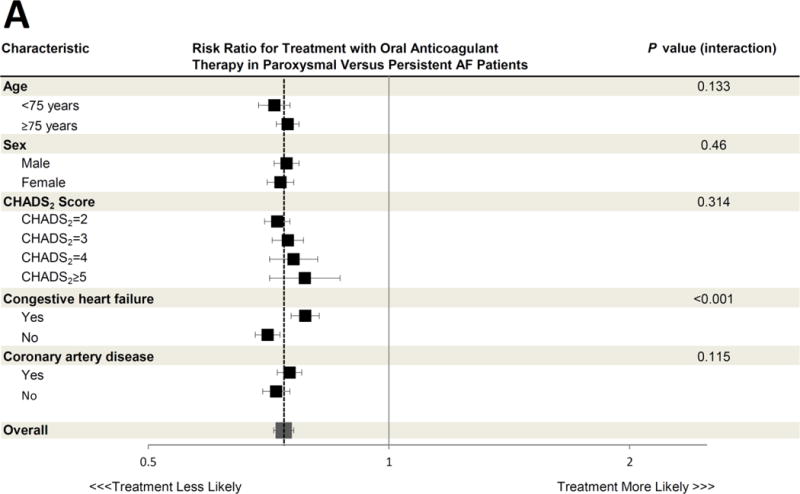
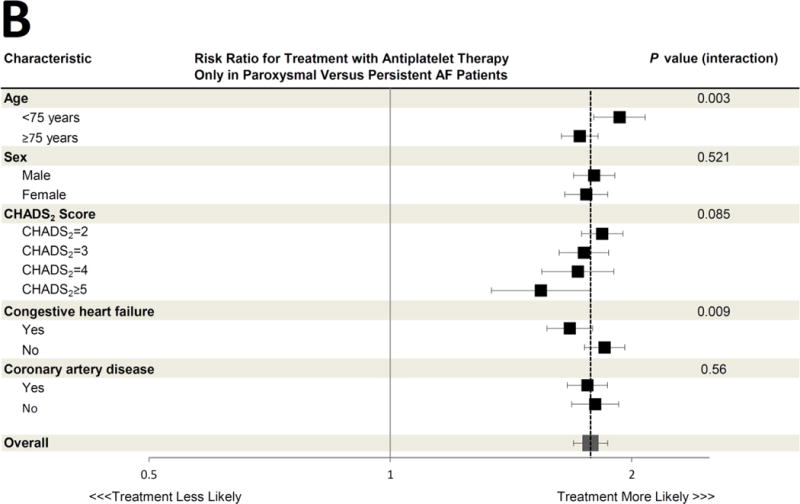
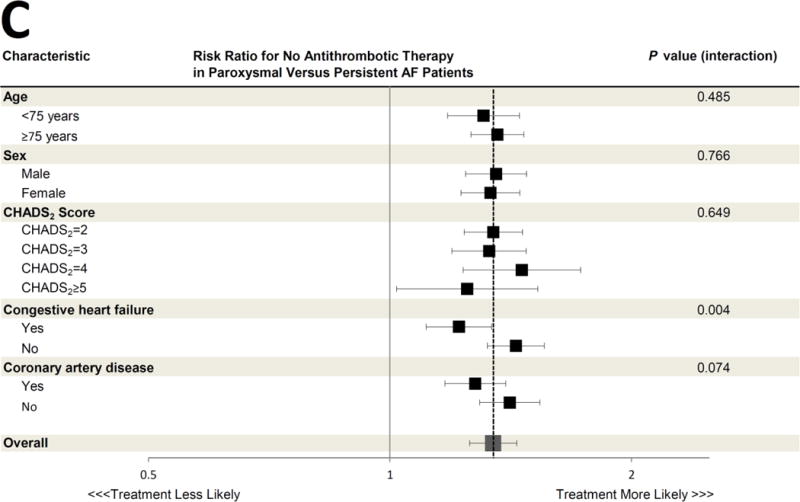
Figure 2. Association between Paroxysmal versus Persistent Atrial Fibrillation Classification and Antithrombotic Prescription, According to Selected Clinical Characteristics.


The adjusted risk ratios for treatment with oral anticoagulant therapy (Panel A), antiplatelet therapy only (Panel B), and no antithrombotic therapy (Panel C) in paroxysmal versus persistent AF patients are shown for various pre-specified subgroups. All risk ratios are adjusted for the same covariates listed in Figure 1. The dashed vertical line in each panel represents the overall adjusted risk ratio representing the likelihood of each therapy for the entire cohort (also represented by the large grey box), and the horizontal error bars denote 95% confidence intervals for each point estimate. Several subgroup treatment interactions were identified, with an interaction P value <0.05. All other interaction P values exceeded 0.05.
CI = confidence interval; RR = risk ratio
