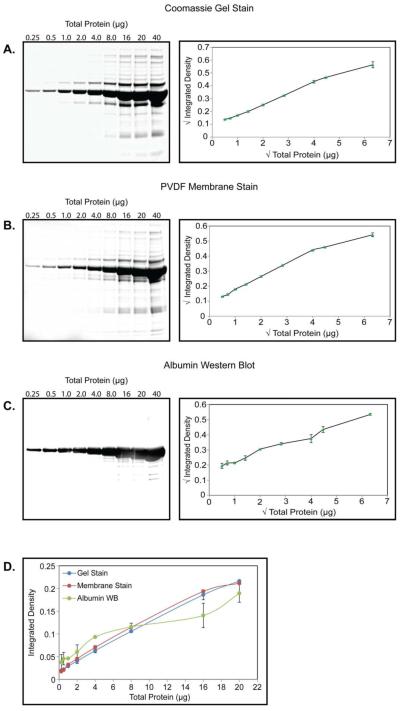
Figure 1.
CSF Total Protein (TP) Linearity. (A) Left, Representative Coomassie stained gel of a serial dilution of increasing amounts of CSF TP ranging from 0.25 μg to 40 μg from the same sample. Right, quantification of the TP signal. Square root transformed TP amount (x axis) and sum total normalized, square root transformed integrated density (y axis) are plotted in a line-connected XY scatter graph. Data are shown as the mean ± SD for triplicate experiments using separate pooled samples. (B) Same as (A), but for PVDF membrane stain. (C) Same as (A and B), but for albumin Western blot. (D) Comparison of the untransformed values obtained by each method over the range of 0.25-20 μg total protein loading. Data are shown as the mean ± SD for triplicate experiments using separate pooled samples.

