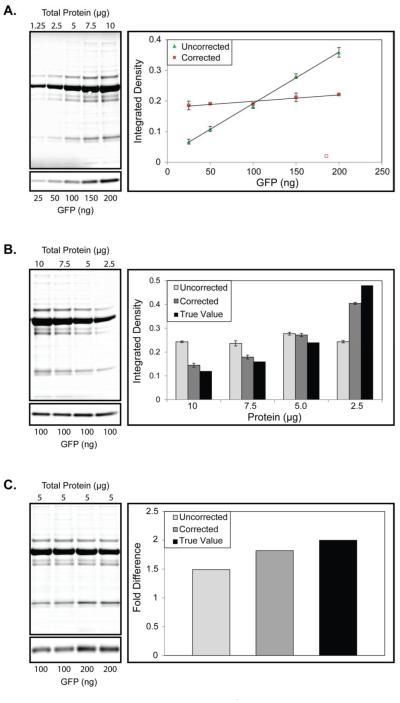
Figure 3.
Corrective Performance of CSF Total Protein (TP) Loading Control. (A) Left, Representative images of in-tandem varying spiked GFP and CSF TP. Right, quantification of the corrected (red squares) and uncorrected (green triangles) normalized integrated density values obtained for each band. (B) Left, representative images of a serially diluted CSF TP stained membrane and equal loading GFP WB are shown. Right, quantification of the resultant uncorrected and corrected normalized integrated density values against the true value based on GFP concentration. (C) Left, representative images of a constant TP stained membrane and two-fold difference loaded GFP WB are shown. Right, the resultant fold-difference obtained from the uncorrected and corrected values is plotted against the true two-fold difference for triplicate experiments. Plots in (A) and (B) represent the mean ± SD of triplicate experiments.

