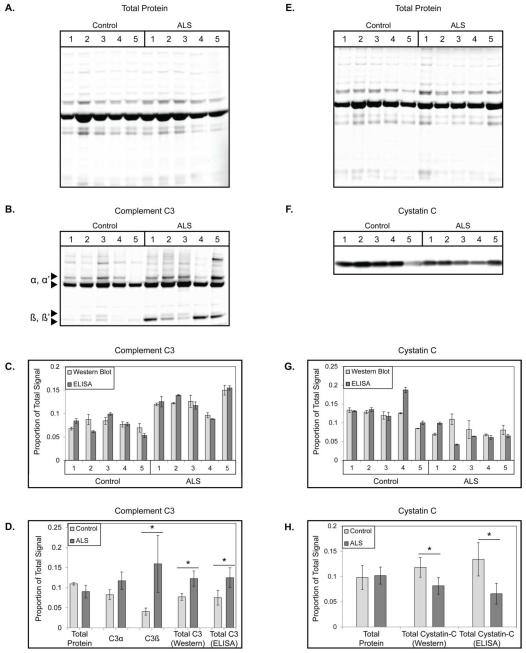
Figure 4.
Application of Total Protein (TP) Loading Correction to Candidate ALS CSF Biomarkers. (A) Representative TP stained membrane of 5 μg total loading for 5 healthy control and 5 ALS CSF samples. (B) Representative WB of complement C3 in the CSF of above healthy control and ALS CSF samples. (C) Plot comparing normalized, relative individual subject C3 levels obtained by ELISA and TP corrected WB from the above CSF samples. (D) Plot comparing normalized, relative between-groups differences for TP, C3α, C3β, total C3 WB, and total C3 ELISA. * = corrected p < 0.05. (E-H) Same as (A-D), respectively, but for cystatin C in a second set of 5 ALS and 5 healthy control CSF samples. Plots A-D represent the mean ± SD of triplicate WB experiments, E-H quadruplicate WB experiments, and all plots show quadruplicate ELISA results.

