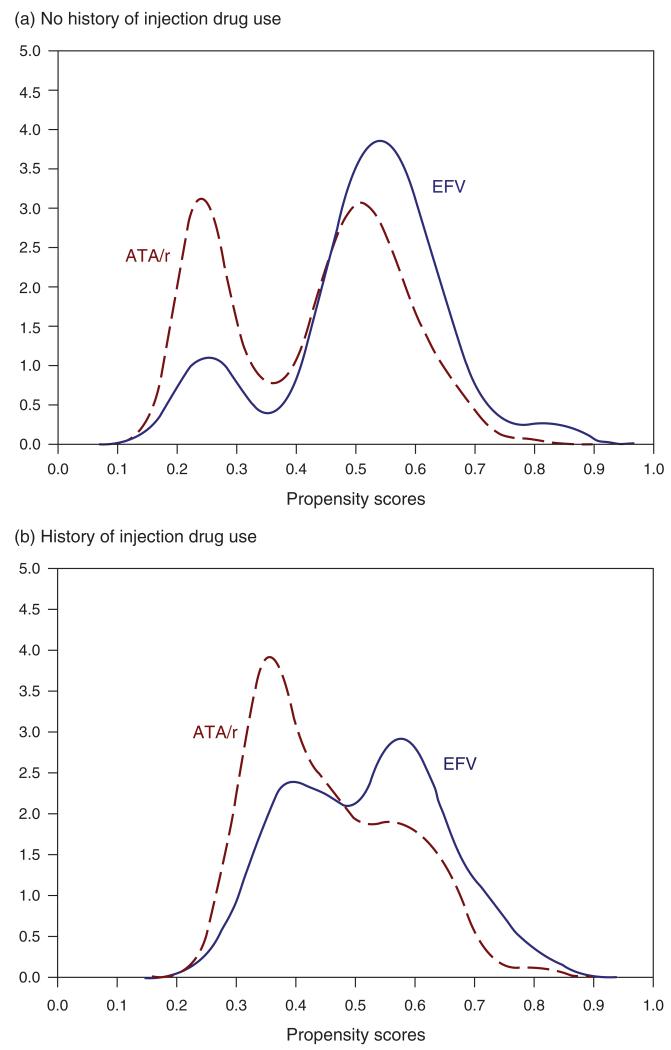
Fig. 2. Estimated probability density function of the propensity scores for EFV-based HAART vs. ATA/r-based HAART, stratified by history of injection drug use.
(a) No history of injection drug use; (b) history of injection drug use. ATA/r, atazanavir boosted with 400 mg/day or less of ritonavir; EFV, efavirenz; X-axis, propensity scores; Y-axis, density distribution.

