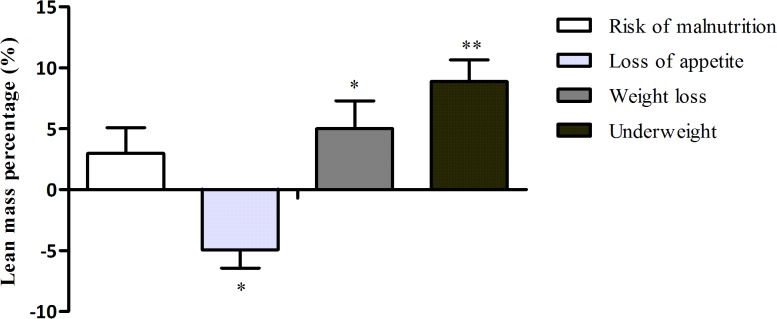
Fig 1. The association between parameters of malnutrition and relative muscle mass, expressed as lean mass percentage.

Lean mass as percentage of body mass is presented as mean (SD) of gender-specific z-scores. Bars represent the difference of lean mass percentage between older persons with the presence of the parameter of malnutrition compared to older persons without the presence of the parameters. P values were calculated with multivariate linear regression analysis including adjustments for age (and body mass in the association with loss of appetite). * = p<0.05. ** = p<0.001.
