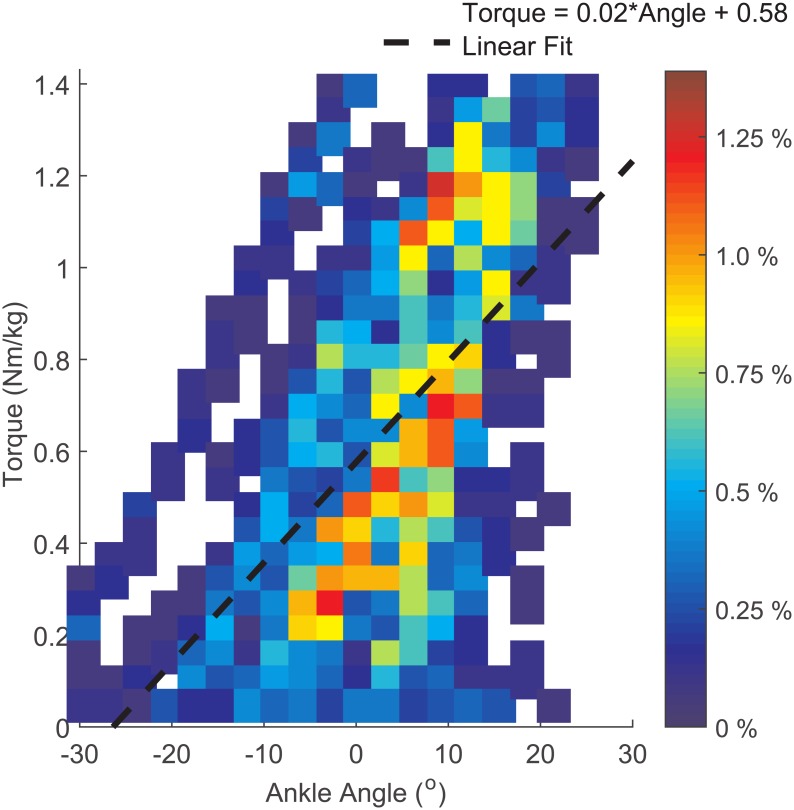
Fig 2. Torque vs. ankle angle data.
Non-amputee ankle torque plotted against ankle angle for the under arm dance step. The color of the region indicates the percentage of the dance step data within the region; the darkest red regions had the highest concentration of data. The line of best fit is shown, which was used as the basis for the biologically inspired control system.

