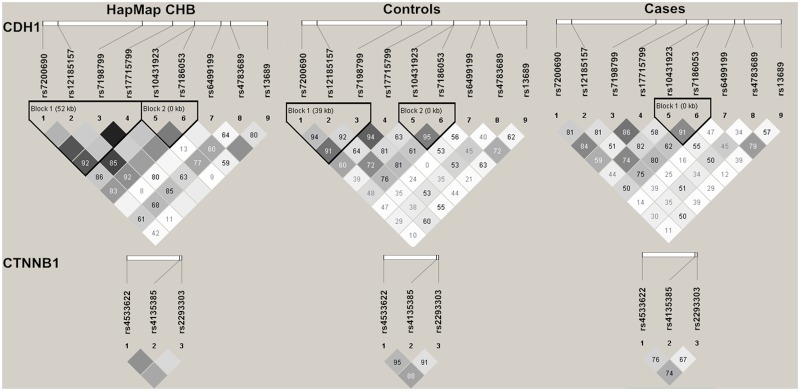
Fig 1. LD maps of htSNPs in HapMap CHB population, controls and breast cancer cases.
The values shown in each diamond are the D’×100 (10 means 0.10, 1 means 0.01) and indicate pairwise LD between htSNPs. The dark grey-to-white gradient reflects higher to lower LD values. Dark grey diamonds without a number indicate a complete LD (D’ = 1).

