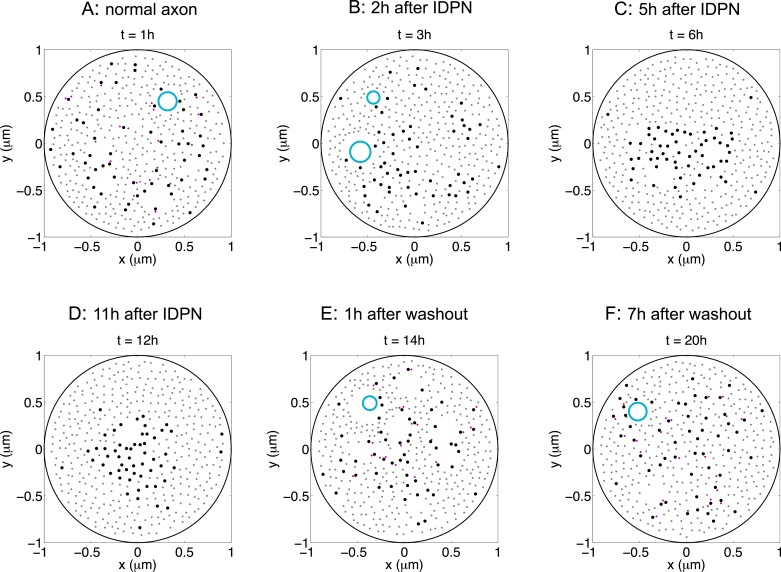
Fig 4. Reversible segregation of microtubules and neurofilaments in a single realization of the model.
Neurofilament transport is blocked starting at t = 1 h and restored at t = 13 h. (A-F) Snapshots of the positions of microtubules, neurofilaments and organelles at t = 1 h, 3 h, 6 h, 12 h, 14 h, 20 h. All panels are from a single realization of the model. Large black dots are microtubules; small grey dots are free neurofilaments; small purple dots are neurofilaments engaged with microtubules; large cyan circles are organelles. (A) Microtubules and neurofilaments form a mixture under normal conditions. (B-D) Blockage of neurofilament transport leads to gradual segregation of microtubules and neurofilaments. (E,F) Restoration of neurofilament transport causes remixing of microtubules and neurofilaments. Parameters used: n M = 56, n N = 361. Neurofilament on-rate equals 0 between t = 1 h and 13 h. All other parameters are the same as in Table 1.

