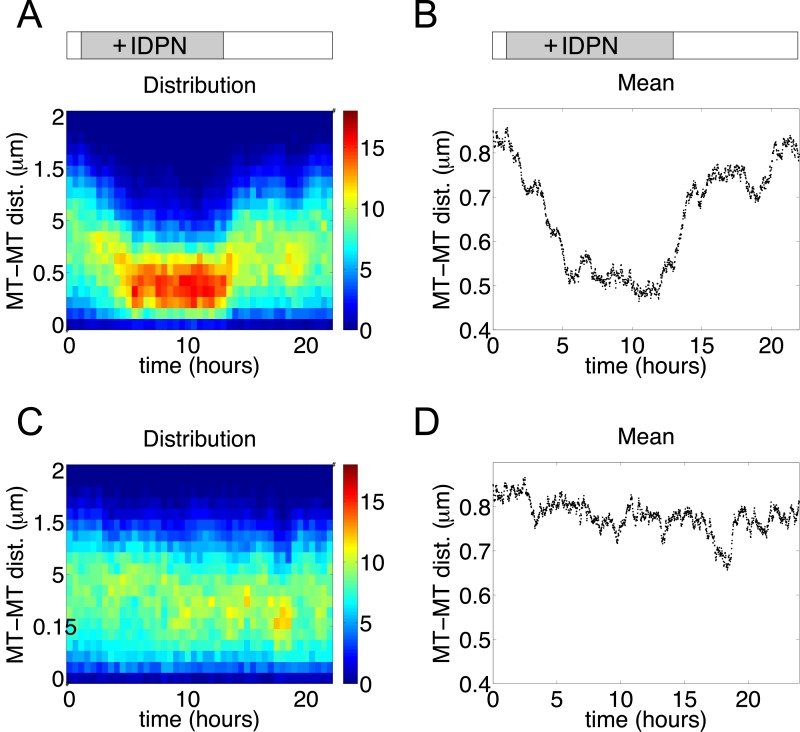
Fig 5. Statistics of the pairwise distances between microtubules (PDMT).
(A, B) IDPN treatment started at t = 1 hour and stopped at t = 13 hours. (C, D) Control. (A, C) Distribution of the PDMT; data plotted for every 20 min. The pseudo color key represents the number of microtubule pairs. (B, D) Mean of the PDMT; data plotted for every min. Parameters used are the same as in Fig 4.

