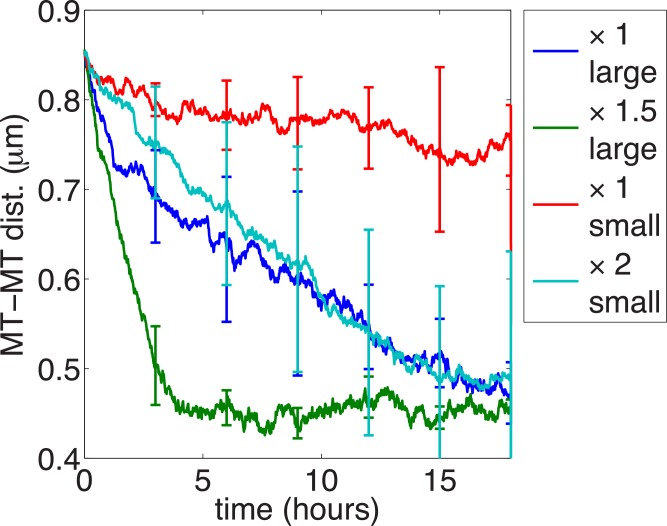
Fig 7. The segregation process depends on organelle size and flux rate.
The mean PDMT is plotted over time. Organelle max radius b: 140 nm for blue and green curves (same as Fig 4); b = 70 nm for red and cyan curves. Organelle flux rate : same as Fig 4 (x1; blue and red), 1.5-fold greater (x1.5; green) and 2-fold greater (x2; cyan). Each curve represents an average of 5 realizations of the model and the error bars are the standard deviation. All other parameters are the same as in Fig 4.

