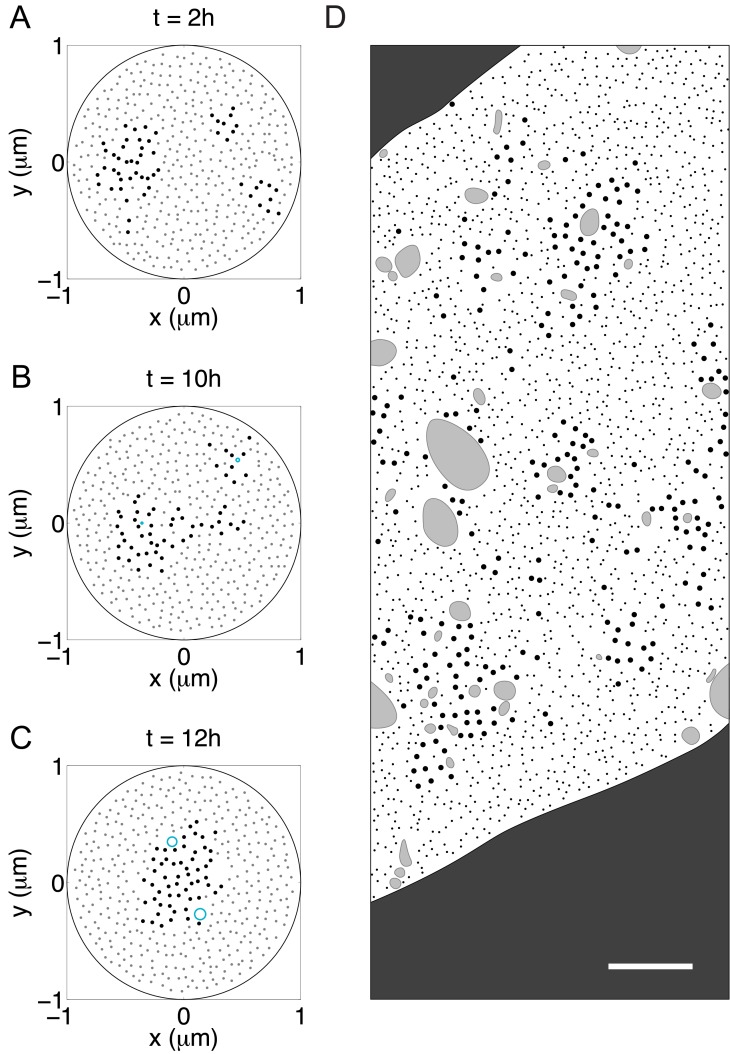
Fig 8. Segregation proceeds by the coalescence of microtubule islands.
(A-C) Snapshots of the segregation process in a single realization of the model. Large black dots are microtubules, small grey dots are neurofilaments, and cyan circles are organelles. (A) Microtubules form three clusters by t = 4 h. (B) These clusters remain separated for several hours until two of them merge around t = 8 h. (C) Finally, all microtubules form a single big cluster near the center of the domain. The dimension of the organelles: b = 70 nm, a/b = 10. The flux rate of the organelles: 0.21 /s. All other parameters are the same as in Fig 4. (D) A drawing based loosely on the electron micrograph in Fig 9A of Zhu et al. [73], showing a cross-section of an L5 ventral nerve root axon from an animal that was exposed to IDPN. Due to copyright restrictions we are not able to show the actual micrographs. The authors administered IDPN in physiological saline to adult mice by intraperitoneal injection (1.5 mg/g body weight) and supplemented with 0.02% IDPN in the drinking water. For the micrograph on which this drawing is based, the animal was sacrificed 1 week after the first injection. Full experimental details can be found in the original article. Note the presence of multiple microtubule clusters, which resembles the intermediate stages of segregation in the simulations. Microtubules are represented by the large black dots, neurofilaments by the small black dots, and membranous organelles by the irregularly shaped grey blobs. The dark grey area outside of the axon is the myelin sheath. The scale bar is 0.4 μm.

