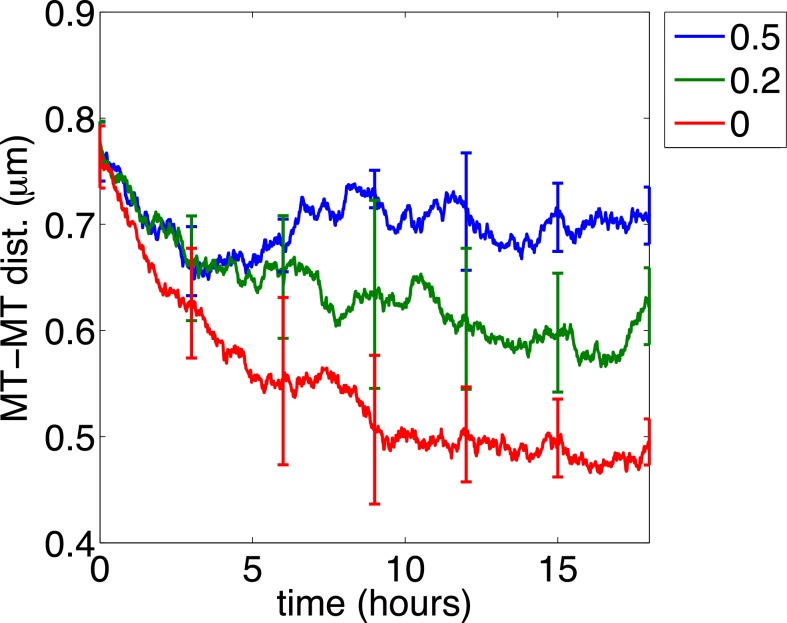
Fig 9. Dependence of microtubule-neurofilament segregation on .
Each curve plots the mean of the PDMT over time averaged over five realizations, and the error bars are the standard deviations. The rate is reduced to 50% (blue), 20% (green), and 0% (red) of the value in Fig 4 at t = 1 h. All other parameters are the same as in Fig 4.

