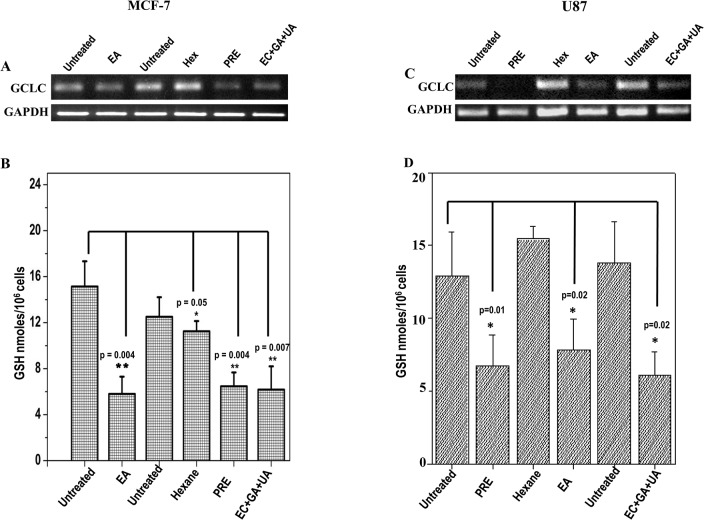
Fig 6. Expression pattern of GCLC in (A) MCF-7 cells and in (C) U87 cells treated with or without PRE, EA, Hex fractions and mixture of EC+GA+UA.
Two independent untreated samples were used in this study. Lower panel shows quantitative densitometric analysis of the expression profile of GCLC mRNA level. The values are the mean±SEM of two independent experiments and are normalized to respective GAPDH values. Levels of glutathione in (B) MCF-7 cells and (D) U87 cells treated with or without PRE, EA, Hex fractions and EC+GA+UA. Two independent untreated samples were used in this study. Values are mean±SEM of three different experiments. *p<0.05, Students’ t-test as compared with untreated control.

