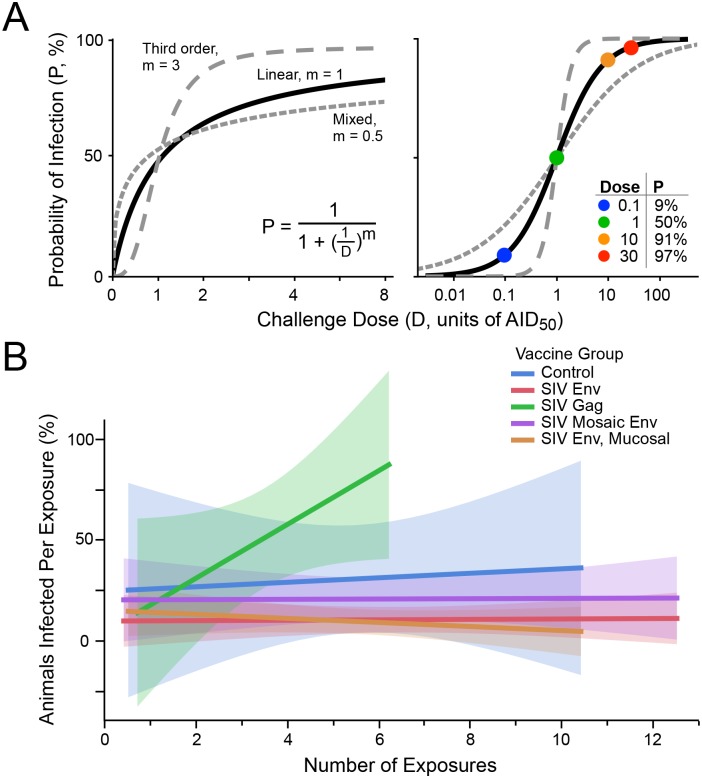
Fig 1. Infection probability as a function of challenge dose.
(A) Modeling the probability of infection (P) as a function of the pathogen challenge dose (D). At D = 1, P = 0.5 (i.e., AID50, the dose that will infect 50% of the time). The curves for linear kinetics (solid; m = 1), third order kinetics (long dashes; m = 3), and mixed kinetics (short dashes, m = 0.5) are shown on linear (left) and logarithmic (right) scaling. The inset table on the right illustrates some values for P at different doses, for linear kinetics. (B) Five groups of NHP were challenged with a moderate dose of SIVsmE660 (a dose that gave 30% infection in unvaccinated animals, or approximately 0.4 AID50). Data are taken from a published study [15]. Env immunized groups were partially protected, showing lower infection rates overall. Shown is the fitted infection rate (linear least squares, with shaded confidence intervals), at each challenge point (i.e., among animals remaining uninfected following prior exposures). There is no decline in infection rate over time, indicating no acquisition of immunity to infection nor selection for innately-resistant animals.

