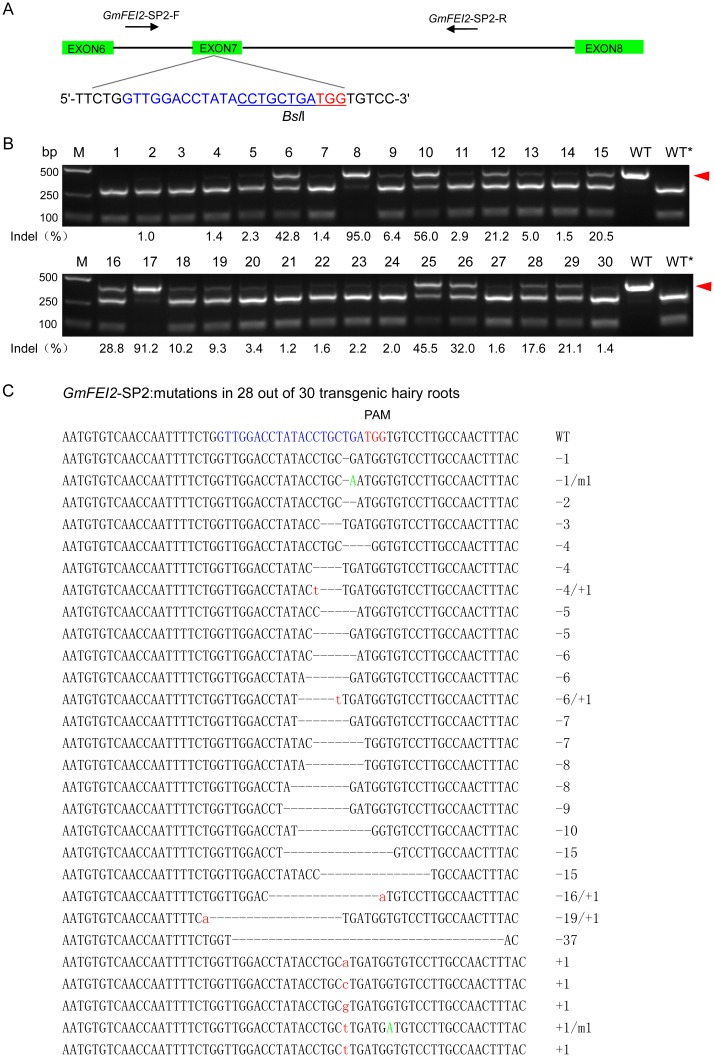
Fig 2. CRISPR/Cas9-induced mutations in the GmFEI2-SP2 target site.
(A) Schematic illustrating the GmFEI2-SP2 target sequence (blue) and corresponding PAM (red). PCR amplification spanning the target loci was conducted using the primers GmFEI2-SP2-F and GmFEI2-SP2-R. The restriction enzyme BslI at the Cas9 cleave site is underlined. (B) PCR/RE assay to detect CRISPR/Cas9-induced mutations in target loci. Lanes 1–30, PCR products of samples treated with sgRNA: Cas9 were digested with BslI. Lanes WT and WT*, undigested and digested wild-type controls, respectively. The red arrowhead indicates the undigested bands. The numbers at the bottom of the gels indicate mutation frequencies measured according to band intensities. M, DL2000 ladder DNA marker. (C) Cloning and sequencing of the undigested bands. Deletions and insertions are indicated as dashes and red lowercase letters, respectively. Base substitutions are indicated with green capital letters. The types of indels are indicated in the right column.

